🍁🏙️🚗 Gardiner Traffic Slowdowns are Impacting Business Productivity, Geotab ITS Analysis Reveals
Friday, 07 June 2024 10:23.AM
- Travel times have increased 250% in the morning rush hour period -
The latest construction project on the Gardiner Expressway — a major transportation route which is traveled by approximately 140,000 vehicles each day — has already made an impact on driving time and emissions. A Geotab ITS study on commercial vehicle traffic on the Gardiner reveals that recent slowdowns due to construction are having an impact on business productivity in Toronto:
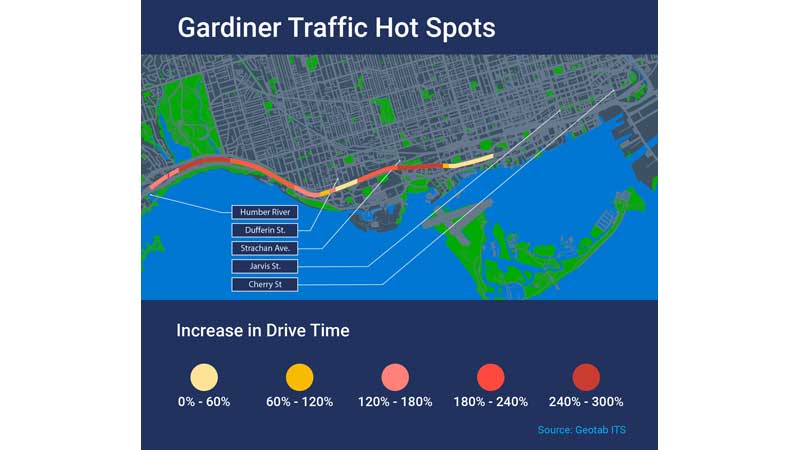
• Travel times on the Gardiner have increased up to 250% in the morning rush hour and 230% in the afternoon rush hour.
• Commercial drivers are spending 80% more time driving per day on the Gardiner.
• Emissions have increased 23% due to the extra driving time (an additional 1,200 kg of CO2 per day).
• The amount of traffic traveling less than 25 km/hr has doubled.
• The top three alternate roads have seen an average traffic increase of 43%.
Significant increase in travel time during commuting hours
Since construction began on March 25, 2024, commercial vehicle drivers are spending more time on the road. Travel time in some areas of the Gardiner has doubled. Geotab ITS found that the average time to travel from the Humber River to Strachan Ave. increased from 8 minutes to 20 minutes, and the typical time to travel the 5 km stretch between Jarvis St. and Dufferin St. is now 25 minutes instead of 11 minutes.
During the morning rush hour, from 7-10 am, travel times on the Gardiner increased by up to 250% on the westbound lanes, as compared to pre-construction traffic. Travel times also increased by up to 230% on the Gardiner eastbound during the afternoon rush hour. Average drive times were most impacted around 8 am, as well as the 3 pm and 4 pm commuting hours.
Slowdown adds pressure to last mile delivery
On the Gardiner, commercial vehicle drivers are spending 80% more time driving per day on average compared to the pre-construction period. The rise in travel time is impacting business productivity. The increased drive time adds pressure particularly to last mile delivery companies, which are already facing demand challenges due to the growth in e-commerce.
The Toronto Region Board of Trade reports that traffic congestion costs over $11 billion in productivity losses each year, and impacts trade and productivity in the city. In 2023, there were 19 million annual commercial trips in the Toronto Core, representing 151 million kilometers driven.
Geotab's recent State of Commercial Transportation examined overall productivity and looked at both the average number of trips per day, average driving duration per day and trip to hours ratio as proxies for gained (or lost) productivity by fleets. In this context, we see that commercial fleets have experienced decreased productivity due to the Gardiner closure. For commercial fleets, in addition to the potential impact to service, spending more time in traffic can add up in fuel costs. For every hour of idling, an engine wastes 3 litres of fuel.
Vehicle emissions increased
Longer drive times on the Gardiner are increasing CO2 emissions from commercial vehicles. Increased driving time led to a 23% increase in emissions, equating to approximately an extra 1,200 kg of CO2 daily from the vehicles in the study — the same as the carbon footprint of a premium roundtrip flight from Toronto to Vancouver. As well, Geotab ITS identified a 26% increase in commercial vehicle idling time.
Traffic-related air pollution (TRAP) from cars, trucks and other vehicles is the largest source of air pollution in Toronto. Air pollution can have a negative impact on health and has been linked to respiratory and cardiovascular diseases and cancer, and increased levels of air pollution from traffic reaches up to 250 meters from a major road.
Traffic shifts to secondary roads
Other Toronto roadways have seen increased commercial traffic as drivers seek alternative routes. The top three roads most impacted by commercial traffic congestion, with an average increase of 43%, are:
• Harbour St. (72% increase in travel time)
• Lakeshore Blvd. (30% increase in travel time)
• Cherry St. (27% increase in travel time)
***
Data insights were derived from Altitude, the aggregate transportation analytics platform from Geotab ITS, which provides contextualized insights on fleet and freight vehicle movement in an aggregate micro and macro picture. The analysis was based on over 10,000 commercial vehicles.
SOURCE: Geotab Inc. and Geotab ITS
- Related materials:
- 21-Apr-2026 04:07 PM 🍁🏙️ City of Toronto Mayor calls on Torontonians to participate in Canada’s largest municipal cleanup
- 06-Apr-2026 11:03 AM 2026 🦒 Toronto Zoo. Giraffe Calf Name REVEALED. Adorable Moment!
- 06-Apr-2026 07:57 AM 2026 🦒 Toronto Zoo. Giraffe Calf Name REVEALED. Adorable Moment! (4K 60p HDR, Images)
- 23-Mar-2026 04:52 PM 🚗 New City Data Shows Toronto is Driving Canada's Shift Away From Car Ownership While Calgary Remains the Country's Most Car-Dependent City
- 19-Mar-2026 06:24 AM 2026 👷♀️ Art of the Brick Toronto 🧱 Full Tour + Story Behind the LEGO Exhibition
- 19-Mar-2026 06:21 AM 2026 👷♀️🧱 You Won’t Believe This LEGO Art Exhibition in Toronto | Art of the Brick (4K 60p HDR, Images)
- 14-Mar-2026 12:36 PM 🍁💵🧑🔎Governments of Canada and Ontario Partner to Support Workers Impacted by Tariffs and Global Market Shifts
- 11-Mar-2026 10:28 AM Data Show Stronger Industrial Carbon Pricing Would Cost Oil Sands Producers Just a Timbit A Barrel in 2030 on Average
- 09-Mar-2026 01:00 PM 2026 🚗LEGO® 1950s Cadillac – A Legend Reborn 🧱 AutoShow Toronto 🇨🇦
- 09-Mar-2026 12:57 PM 2026 🚗LEGO® 1950s Cadillac – A Legend Reborn 🧱 AutoShow Toronto 🇨🇦 (4K 60p HDR, Images)
- 06-Mar-2026 08:42 AM 2026 🚗 Ford Legends: Mustang & Bronco Showcase | AutoShow 🇨🇦
- 06-Mar-2026 08:39 AM 2026 🚗 Ford Legends: Mustang & Bronco Showcase | AutoShow 🇨🇦 (4K 60p HDR, Images)
- 05-Mar-2026 07:38 AM 2026 🚗 MINI JCW x Deus at Canadian International AutoShow | JCW 3 Door & 312HP Countryman
- 05-Mar-2026 07:34 AM 2026 🚗 MINI JCW x Deus at Canadian International AutoShow | JCW 3 Door & 312HP Countryman (4K 60p HDR, Images)
- 02-Mar-2026 07:24 PM 2026 🏎️ $10M+ Hypercars at Canadian International AutoShow | Pagani, Bugatti, McLaren
- 02-Mar-2026 07:19 AM 2026 🏎️ $10M+ Hypercars at Canadian International AutoShow | Pagani, Bugatti, McLaren (4K 60p HDR, Images)
- 26-Feb-2026 07:43 AM 2026 🚗 Project Arrow Borealis & Vector Global Debut | Toronto AutoShow
- 26-Feb-2026 07:40 AM 2026 🚗 Project Arrow Borealis & Vector Global Debut | Toronto AutoShow (4K 60p HDR, Images)
- 24-Feb-2026 08:35 PM 2026 🚗 Cobble Beach Classics at Canadian International AutoShow . 1906–2003 Collector Icons
- 24-Feb-2026 08:31 AM 2026 🚗 Cobble Beach Classics at Canadian International AutoShow . 1906–2003 Collector Icons (4K 60p HDR, Images)
- 22-Feb-2026 01:49 PM 2026 🏎️⚔️ Canadian International AutoShow | Canadian Armed Forces Military Tech Showcase
- 22-Feb-2026 11:42 AM 2026 🏎️⚔️ Canadian International AutoShow | Canadian Armed Forces Military Tech Showcase (4K 60p HDR, Images)
- 22-Feb-2026 11:37 AM 2026 🏎️ Canadian International AutoShow | Media Day Walkthrough •Supercars •EVs •Concepts
- 22-Feb-2026 11:27 AM 2026 🏎️ Canadian International AutoShow | Media Day Walkthrough •Supercars •EVs •Concepts (4K 60p HDR, Images)
- 21-Feb-2026 01:19 PM 2026 🚗 Canadian International AutoShow 🔥🏎️ Audi Exhibit Walkthrough
- 21-Feb-2026 01:15 AM 2026 🚗 Canadian International AutoShow 🔥🏎️ Audi Exhibit Walkthrough (4K 60p HDR, Images)
- 17-Feb-2026 07:46 PM 2026🏎️ Toronto AutoShow. AUDI R26 Formula 1 Concept REVEALED! 🔥 Future F1 Design
- 17-Feb-2026 11:30 AM 2026🏎️ Toronto AutoShow. AUDI R26 Formula 1 Concept REVEALED! 🔥 Future F1 Design (4K 60p HDR, Images)
- 06-Feb-2026 05:08 PM 🚗 General Motors is Canada's Electric Vehicles Sales Leader in 2025
- 06-Feb-2026 02:00 PM Upcoming Event: 🥘😋 NIssan Brings Ingenuity to Game Day Snacking with New Rogue Spot Starring Canadian Chef Matty Matheson
- 05-Feb-2026 04:33 PM Upcoming Event: 💻🔒🚗 A First in Toronto: OLIJEL Launches the Intelligent Anti-Theft System IKS at the Canadian International AutoShow 🍁🏙️
- 02-Feb-2026 02:42 PM 💵 Competition Bureau Report Highlights Public Feedback on Algorithmic Pricing and Competition
- 31-Jan-2026 08:00 AM 👧👧 Knights of Columbus Delivers Record-Breaking 20,736 Coats to Kids in Need in Ontario
- 29-Jan-2026 08:00 AM Upcoming Event: 📅🎭🎶🎻🎄 Happy New Year from Dr. Draw and The Strange Parade
- 16-Jan-2026 12:00 PM 🚗 Global Automakers of Canada Reacts to Canadian Government Granting Entry to Canadian Market to Chinese Electric Vehicles
- 04-Jan-2026 04:03 AM 🍁🏙️ What Was New in the City of Toronto in 2025
- 01-Jan-2026 12:00 PM 🧑🔎🚗 Canadians Call for s New Automotive Strategy to Build Canada Strong: New KPMG Canada Survey
- 29-Nov-2025 10:33 AM 🇨🇦🍁💵Canada Drives Innovation to Reduce Vehicle Emissions 🚗
- 26-Nov-2025 03:52 AM 🍁🏙️💼📊 Ontario Investing $2.6 Million to Help More Youth Gain Experience in the Skilled Trades
- 18-Aug-2025 10:21 AM 🍁🏙️🍬 Sweetening Back-to-School: HARIBO's World of Phantasia Brings Imagination, Candy and a Cause to Toronto 🍭
- 15-Aug-2025 12:00 PM 🇨🇦🍁💵 Canada Accelerates Transition to Zero-emissions Vehicles 🔌🚗
- 14-Aug-2025 06:47 PM 🍁🏙️👔👚 Simons Opens First Urban Toronto Location at Yorkdale Shopping Centre 👗👖
- 21-Jun-2025 02:24 PM 🍁🏙️ City of Toronto Launches Cleaning Blitz to Protect Public Spaces, Streets and Parks 🧹
- 15-Jun-2025 12:00 PM 🍁🏙️ GTA Residents Sound Alarm: Nearly 80% Call Auto Theft a Crisis 🚓🏎️
- 15-May-2025 07:33 AM 2025 🚘 Canadian International AutoShow FULL Walkthrough
- 15-May-2025 04:24 AM 2025 🚘 Canadian International AutoShow FULL Walkthrough (4K 60p HDR, Images)
- 05-May-2025 04:33 PM Upcoming Event: 📅🎪 Cirque du Soleil OVO at the Zoo!
- 05-May-2025 10:06 AM Upcoming Event: 🚴🍁🏙️ Ride the DVP Traffic-Free! Join Our Team for Bike for Brain Health
- 03-May-2025 12:00 PM Upcoming Event: 📅🍁🏙️ Doors Open Toronto invites everyone to explore and play in the city on May 24 and 25
- 03-May-2025 10:37 AM Upcoming Event: 📅🎵🍁🏙️ Toronto Japanese Film Festival Announces Exciting Additions To 14th Annual Line Up
- 02-May-2025 02:33 PM ⚠️⚕️🍁🏙️ Toronto Public Health Advising of Potential Measles Exposure at Major Tourist Attraction
- 02-May-2025 10:48 AM 🍁🏙️⚕️ City of Toronto Opens Seasonal Washrooms and Water Fountains at Parks for the Spring Season
- 01-May-2025 04:33 PM ONTARIO 🍁🚗🔐 Ontario Fighting Auto Theft by Cracking Down on Car Thieves
- 01-May-2025 08:00 AM Upcoming Event: 📅🧙✨🎩 Unlock the Magic: David Kwong's 'The Enigmatist' makes Canadian Debut in Toronto This June!
- 30-Apr-2025 10:23 AM Happening Now: 🍁🏙️📅 City Of Toronto Celebrates Youth Week with More Than 30 Events Across the City
- 28-Apr-2025 04:43 PM Upcoming Event: 📅 Minecraft Experience Makes its Canadian Debut at Square One Mississauga this
- 17-Apr-2025 08:00 AM 🍁🏙️ City Of Toronto to Conduct Traditional and Prescribed Burns
- 16-Apr-2025 02:33 PM 🍁🏙️ 👮♂️🚔 New Automated Speed Enforcement Cameras Helping to Reduce 🚓
- 11-Apr-2025 08:00 AM Happening Now: 📅🎭🍁🏙️ Experience The Legacy Of Vincent Van Gogh Like Never Before: New Edition Of Immersive Van Gogh Premieres In Toronto! 🖼
- 05-Apr-2025 04:33 PM ONTARIO 💵🚗 Ontario Doubling Hydrogen Innovation Fund to $30 Million to Protect Ontario Jobs
- 05-Apr-2025 12:00 PM Upcoming Event: 📅🎭🍁🏙️ Happy Birthday AGO! Ontario’S Art Gallery Celebrates Its 125Th Anniversary All Summer Long
- 04-Apr-2025 04:33 PM 🍁🏙️💵 City of Toronto Proposes Measures to Enhance Traffic Congestion Management 🚗
- 03-Apr-2025 12:00 PM Upcoming Event: 📅🚢🍁🏙️ Toronto Waterfront Festival Announces 2025 Tall Ships Return
- 03-Apr-2025 10:22 AM Happening Now: 📅🎭🍁🏙️ The New Immersive Van Gogh: The Next Chapter Canadian Premiere 🖼
- 01-Apr-2025 06:30 PM 🍁🏙️💵 City of Toronto and Government of Canada Enter $2.55 Billion Landmark Agreement in Principle to Build More Rental Homes Faster 🏠
- 01-Apr-2025 09:00 AM 2025 🚗 Canadian AutoShow. 🔥 Audi Unveils 5 New Cars at the 2025 - SQ5, A5, S6 e-tron, Q6, SQ6 e-tron
- 01-Apr-2025 08:42 AM 2025 🚗 Canadian AutoShow. Audi Unveils 5 New Cars at the 2025 - SQ5, A5, S6 e-tron, Q6, SQ6 e-tron (4K 60p HDR, Images)
- 31-Mar-2025 04:25 AM Upcoming Event: 📅🎭🍁🏙️ Dr. Neil deGrasse Tyson Coming to Toronto – Tickets on Sale Tomorrow! 🎵
- 27-Mar-2025 10:30 AM Upcoming Event: 📅🎭🍁🏙️ Saul Rubinek In His Triumphant Return In The Hilarious And Poignant Playing Shylock Opening At The CAA Theatre April 1-6
- 25-Mar-2025 09:11 AM 2025 🚗 Canadian International AutoShow: The Most Stunning Luxury & Exotic Cars!
- 25-Mar-2025 09:07 AM 2025 🚗 Canadian International AutoShow: The Most Stunning Luxury & Exotic Cars! (4K 60p HDR, Images)
- 24-Mar-2025 02:23 PM 🍁🏙️ Calling all young poets! City of Toronto launches Children’s Spring Poetry Contest 📚📖🖋️
- 22-Mar-2025 02:36 AM 🍁🏙️ 💵 City Of Toronto Launches "Love Local" Campaign to Support Businesses and Strengthen Canada’s Economic Resilience
- 18-Mar-2025 08:00 AM 🍁🏙️ City of Toronto launches public engagement on proposed bylaw about demonstrations near vulnerable institutions
- 17-Mar-2025 12:00 PM 🍁🏙️ City of Toronto protects local economy with new Mayor’s Economic Action Plan in response to US tariffs 💵
- 13-Mar-2025 12:00 PM 🍁🏙️ 💵 767 new homes coming to Toronto 🏠
- 12-Mar-2025 02:33 PM 🍁🏙️ Ferries review to strengthen operations amid historic revitalization work
- 02-Mar-2025 04:53 PM 2025 🚔 Police and Community Engagement at the 2025 Toronto Autoshow 🚓👮
- 02-Mar-2025 04:47 PM 2025 🚔 Police and Community Engagement at the Toronto Autoshow 🚓👮 (4K 60p HDR, Images)
- 01-Mar-2025 01:21 PM 2025 🚗 Toronto Autoshow - 2026 Rivian R2 Debuts in Canada. First Look at the New Electric SUV (4K 60p HDR, Images)
- 01-Mar-2025 01:18 PM 2025 🚗 Toronto Autoshow - 2026 Rivian R2 Debuts in Canada 🇨🇦 | First Look at the New Electric SUV (4K 60p HDR, Images)
- 27-Feb-2025 08:31 PM 2025 🚗 Toyota 4Runner First Look at Toronto AutoShow. Hybrid SUV, Trailhunter & More!
- 27-Feb-2025 08:27 PM 2025 🚗 Toyota 4Runner First Look at Toronto AutoShow. Hybrid SUV, Trailhunter & More! (4K 60p HDR, Images)
- 26-Feb-2025 09:38 PM 2025 🚗 Lexus Debuts at the Canadian International AutoShow | New LX 700h, EVs & Performance Cars (4K 60p HDR, Images)
- 26-Feb-2025 08:42 PM 2025 🚗 Lexus Debuts at the Canadian International AutoShow | New LX 700h, EVs & Performance Cars
- 22-Feb-2025 07:24 PM 2025 🚗 Canadian International AutoShow – LEGO® Technic McLaren P1 Debut! 🔥🏎️
- 20-Feb-2025 11:15 PM 2025 🚗 Canadian International AutoShow – LEGO® Technic McLaren P1 Debut! 🔥🏎️ (4K 60p HDR, Images)
- 20-Feb-2025 09:42 PM 2025 🚗 Canadian International AutoShow. 2025 Chevrolet Corvette ZR1 🔥🏎️ (4K 60p HDR, Images)
- 20-Feb-2025 08:45 PM 2025 🚗 Canadian International AutoShow. 2025 Chevrolet Corvette ZR1 🔥🏎️
- 19-Feb-2025 12:00 PM 🍁🏙️ City of Toronto publishes new transportation datasets that highlight travel trends and support traffic management actions 🚘
- 18-Feb-2025 08:20 PM 2025 🚗 Polestar at the Canadian International AutoShow. Full Electric Vehicle Showcase (4K 60p HDR, Images)
- 18-Feb-2025 07:23 PM 2025 🚗 Polestar at the Canadian International AutoShow. Full Electric Vehicle Showcase
- 17-Feb-2025 06:33 PM 🍁🏙️ Toronto Public Health releases updated data for deaths of people experiencing homelessness in Toronto
- 17-Feb-2025 08:39 AM 2025 🚗 Canadian International AutoShow. BMW/MINI Impressive Return! 🏎️🚘🚙
- 16-Feb-2025 09:33 AM 2025 🚗 Canadian International AutoShow. BMW/MINI Impressive Return 🏎️🚘🚙 (4K 60p HDR, Images)
- 15-Feb-2025 12:00 PM 🍁🏙️ City of Toronto issues 2025 interim property tax bills 💵🏠
- 12-Feb-2025 10:10 AM 🍁🏙️ Get ready for spring! City of Toronto launches spring recreation program listings for all ages
- 09-Feb-2025 02:25 PM 🍁🏙️ More than halfway to the deadline: 2024 Vacant Home Tax declaration reminder 💵🏠
- 24-Jan-2025 12:00 PM ⚕️💵🧑🔎 Grey Matter Neurosciences Secures License for World-Leading Focused Ultrasound Technology from Sunnybrook Research Institute, Announces $14 Million Financing to Advance Treatment for Alzheimer's Disease
- 13-Jan-2025 10:22 AM 🍁🏙️ City of Toronto Launches 2025 Budget Process, Prioritizing Investments on Affordability, Transportation, Safety and Community Services
- 19-Nov-2024 08:00 AM 🚓👮 Avoid the Winter Wallop: CAA, Toronto Police Service And OPP Team Up with Winter Weather Readiness Tips
- 08-Oct-2024 02:34 PM 🏙️🖼️ Nuit Blanche Toronto 2024: Extended Program Features 12 Art Projects
- 18-Sep-2024 11:37 AM 🇨🇦🍁💵 Thousands of New EV Chargers Across Canada Will Support Canadians' Green Transportation Choices 🚗🔌
- 17-Sep-2024 12:00 PM 🍁🏙️💵 Calling All Gardeners! City of Toronto Opens Applications for its Fall Pollinateto Grants 🌸🌿🌺
- 17-Sep-2024 10:37 AM 🍁🏙️ City Of Toronto Increases Fines as Part of Don’T Block the Box Program to Help Combat Congestion and Enhance Road Safety
- 14-Sep-2024 10:23 AM 🍁🏙️ City of Toronto Opens New Leslie Lookout Park with Stunning Views 🌲🌄
- 13-Aug-2024 10:39 AM 🍁🏙️ ⚕️ Toronto Public Health Urges Eligible Residents to Get Vaccinated Against Mpox as Local Cases Continue to Rise
- 10-Aug-2024 08:00 AM Upcoming Event: 🍁🏙️ SummerSeries in Trillium Park at Ontario Place Presents Wavelength Summer Thing and City Hall Live
- 09-Aug-2024 10:32 AM 🍁🏙️ 💼💰🤝 Get Hired: City of Toronto Winter Jobs Heating Up With Cool Opportunities
- 08-Aug-2024 02:27 PM 🍁🏙️ 💵 City of Toronto and the Government of Canada announce agreement to fund West Toronto Railpath Extension
- 08-Aug-2024 10:23 AM 🍁🏙️ 💵 City of Toronto Enhancing Community Recreation Centres with Fresh Paint, Public Wi-Fi and Additional Features
- 06-Aug-2024 12:00 PM 🍁🏙️ City of Toronto Parking Fines to Increase on August 1 to Support Safer Roads and Reduce Congestion 💵🚗
- 31-Jul-2024 02:30 PM 📅Upcoming Event: ✈️ 2024 AirShow. Italian Air Force to Fly Over Toronto for the First Time in Over 30 Years 🍁🏙️
- 31-Jul-2024 08:42 AM 📅🎭 Just Announced: Evil Dead The Musical 20th Anniversary Production Opens This October In Toronto 🍁🏙️
- 23-Jul-2024 04:27 PM 🍁🏙️⚕️ New Toronto Public Health Strategic Plan Envisions a City Where All People Can be Healthy and Thrive
- 21-Jul-2024 12:00 PM 🍁🏙️ 💵 Toronto Mayor Olivia Chow Announces $2 Million in Funding to Support Toronto’S Festivals
- 16-Jul-2024 12:00 PM 🍁🏙️⚕️ Toronto Public Health Confirms First Mosquitos to Test Positive for West Nile Virus in 2024
- 15-Jul-2024 04:30 PM ONTARIO FRAUD 🚗 Taking Steps to Track and Reduce Auto Insurance Fraud in Ontario - Join FSRA's webinar to learn about our new Proposed Rule and Guidance
- 15-Jul-2024 12:00 PM 🍁🏙️📱💻 Global EdTech Leaders Witness Radical Learning Transformation at D2L Fusion 2024 📚🎓🧠
- 17-Jun-2024 08:00 AM 🍁🏙️⚠️🌡️ City Of Toronto Shares Advice for Residents to Keep Cool During First Heat Event of Summer ⚕️
- 16-Jun-2024 08:00 AM 🚗🔐 Insurance Bureau of Canada Reveals the Top 7 Hot Spots in Atlantic Canada for Auto Theft Claims
- 13-Jun-2024 12:00 PM 🍁🏙️⚠️⚕️ Toronto Public Health Reminds Residents to Take Precautions Against West Nile Virus This Summer 🦟
- 11-Jun-2024 06:25 PM 🍁🏙️🚗 City of Toronto launches public consultations on vehicle-for-hire regulations
- 14-May-2024 12:00 PM ONTARIO 🚗🔐 Ontario Introducing Stiff Penalties to Combat Auto Theft
- 14-May-2024 10:22 AM 🍁🏙️ Celebrate the Victoria Day Long Weekend with Family Friendly Activities 🧺🥪🎆
- 11-May-2024 02:23 PM 🍁🏙️🌳🌺🌿 Garden Contest Blooms Again to Spotlight Toronto’s Favourite Floras 🌸
- 10-May-2024 12:00 PM ONTARIO 🚗🏎 Ontario Raising Highway Speed Limits 🚗
- 09-May-2024 04:36 PM 🍁🏙️🌍🌞 City of Toronto moves forward with renewed approach to tackle climate change 🌡️🔥❄️
- 09-May-2024 08:00 AM 🍁🏙️ 🔌⚡ Toronto Hydro Shares How to Stay Emergency Ready and Safe from Powerlines 🌩️🌧️
- 08-May-2024 04:33 PM 🍁🏙️ 🍾 Toronto City Council to expand alcohol in parks program city-wide 🏕️
- 08-May-2024 10:22 AM 🚗 Nissan Canada Enhances Car Buying Experience with New E-Commerce Platform 🚗
- 03-May-2024 06:52 AM 🍁🏙️ ⚽ City of Toronto to Receive $104.34 Million in Federal Funding to Support Hosting Fifa World Cup 26 💵
- 02-May-2024 12:00 PM 🍁🏙️🖼️ Mayor Olivia Chow Proclaims May as Museum Month in Toronto, Announces New City-Wide Programming at Toronto History Museums 🖼️
- 02-May-2024 08:00 AM 🍁🏙️ 🖼️ Doors Open Toronto unlocks the city’s hidden histories on May 25 and 26 🏛️🎨🔍
- 01-May-2024 04:32 PM 🍁🏙️ 🧑🔎 Mayor Olivia Chow Lead Toronto's Film Mission to Los Angeles 📽️
- 01-May-2024 10:23 AM ONTARIO🔌🚗 Ontario Exploring Options to Reduce Electricity Rates for Public EV Chargers 🚗
- 27-Apr-2024 04:28 PM ONTARIO 🍁🏙️ Ontario Expanding GO Train Service Across the Greater Toronto Area 🚆💵
- 26-Apr-2024 02:41 PM 🍁🏙️ 🏞️🚻 City of Toronto Turning on the Taps Ahead of Schedule in Parks Across the City 💵
- 25-Apr-2024 06:28 PM 🚗🤖 Sanctuary AI Expands General Purpose Robot Footprint in Automotive Manufacturing Industry 🚗
- 25-Apr-2024 02:23 PM 🍁🏙️ 🚮 City Of Toronto Reveals Enhancements and New Initiatives for Sidewalk Litter Bins
- 24-Apr-2024 06:34 PM 🍁🏙️ 🐕 City of Toronto Taking Actions to Address Dangerous Dog Behaviour 🐕
- 24-Apr-2024 08:00 AM 🚗 Exhibition Place Becomes Testing Site for Sarit, a Next-Generation Electric Vehicle 🚗
- 22-Apr-2024 08:00 AM 🍁🏙️🌳🌲 City of Toronto receives Tree City of the World designation
- 05-Apr-2024 05:21 PM 2024 🚗 Canadian International AutoShow - Explore KIA🏎️🚘🚙 (4K, images)
- 05-Apr-2024 04:23 PM 🚗 2024 Canadian International AutoShow. Explore Kia 🏎️🚘🚙
- 04-Apr-2024 06:03 AM 2024 🚗 Canadian International AutoShow. Explore NISSAN 🏎️🚘🚙 (4K HDR, images)
- 04-Apr-2024 05:07 AM 🚗 Explore NISSAN/INFINITY at the Canadian International AutoShow 2024. Global Autoshow Debut 🏎️🚘🚙
- 02-Apr-2024 06:43 PM 🏗️ Apartment Construction Sustains Housing Starts in Canada's Largest Cities
- 31-Mar-2024 10:34 PM 2024 🚗 Canadian International AutoShow. Explore the Fisker Ocean One 🏎️🚘🚙 (4K HDR, images)
- 31-Mar-2024 09:36 PM 🚗 2024 Canadian International AutoShow. Explore the Fisker Ocean One 🏎️🚘🚙
- 29-Mar-2024 02:21 PM 2024 🚗 Porsche Presenting Five Premieres at the 2024 Canadian International AutoShow 🏎️🚘🚙 (4K HDR, images)
- 29-Mar-2024 01:25 PM 🚗 2024 Canadian International AutoShow. Porsche Presenting Five Premieres 🏎️🚘🚙
- 26-Mar-2024 10:22 AM 🧑🔎🧑🖼️ Over 400 Art Gallery Of Ontario Workers Are on Strike: "The Arts Matter. So Do We!"
- 25-Mar-2024 12:46 AM 2024 🚗 Canadian International AutoShow. 50 Years of Grand Touring Automobiles 🏎️🚘🚙 (4K HDR, images)
- 24-Mar-2024 11:50 PM 🚗 2024 Canadian International AutoShow. 50 Years of Grand Touring Automobiles 🏎️🚘🚙
- 22-Mar-2024 10:52 PM 2024 🚗 Canadian International AutoShow. JEEP Track IN and OUT Experience 🏎️🚘🚙 (4K HDR, images)
- 22-Mar-2024 09:54 PM 🚗 2024 Canadian International AutoShow. JEEP Track IN and OUT Experience 🏎️🚘🚙
- 06-Mar-2024 04:32 AM 2024 🚗 Canadian International AutoShow. EV Test Track 🏎️🚘🚙 (4K HDR, images)
- 06-Mar-2024 03:34 AM 🚗 2024 Canadian International AutoShow. EV Test Track 🏎️🚘🚙
- 05-Mar-2024 10:44 AM 2024 🚗 Canadian International AutoShow. Hyundai x Boston Dynamics’4-legged Walking Robot 🤖 (4K HDR, images)
- 05-Mar-2024 08:00 AM 🚗 2024 Canadian International AutoShow. Hyundai x Boston Dynamics 🤖(4K HDR)
- 03-Mar-2024 04:50 PM 2024 🚗 Canadian International AutoShow. Toyota 🏎️🚘🚙 (4K HDR, images)
- 03-Mar-2024 03:53 PM 🚗 2024 Canadian International AutoShow. Toyota Canada bring at this year autoshow around 20 cars, including number of debuts 🏎️🚘🚙 (4K HDR)
- 27-Feb-2024 04:59 PM 2024 🚗 Canadian International AutoShow. Hyundai 🏎️🚘🚙 (4K HDR, images)
- 27-Feb-2024 04:09 PM 🚗 2024 Canadian International AutoShow. Hyundai is Back With the All-New NHL Edition 2024 Santa Fe 🏎️🚘🚙
- 22-Feb-2024 10:23 AM 🚗 One of the Largest Selections of Pickup Trucks at the 2024 Canadian International AutoShow
- 22-Feb-2024 09:27 AM 2024 🚗 Canadian International AutoShow. VinFast 🏎️🚘🚙 (4K HDR, images)
- 22-Feb-2024 08:29 AM 🚗 2024 Canadian International AutoShow. VinFast 🏎️🚘🚙
- 22-Feb-2024 08:00 AM ONTARIO 🧑🔎🚗 Ontario Supports Auto Workers in Peel and Durham 🏎️🚘🚙 (4K HDR)
- 21-Feb-2024 06:44 AM 2024 🚗 Canadian International AutoShow. Lexus 🏎️🚘🚙 (4K HDR, images)
- 21-Feb-2024 05:48 AM 🚗 2024 Canadian International AutoShow. Lexus 🏎️🚘🚙
- 19-Feb-2024 04:16 PM 🚗 AutoShow Drives Passion for the Automobile
- 18-Feb-2024 06:25 PM 🚗 The Car-Buying Journey Starts at the Canadian International AutoShow
- 18-Feb-2024 08:33 AM 2024 🚗 Canadian International AutoShow. Top 10 MLS goal scorer and alum, Dwayne De Rosario, Joins Chevrolet 🏎️🚘🚙 (4K HDR, images)
- 18-Feb-2024 08:30 AM 🚗 2024 Canadian International AutoShow. Top 10 MLS goal scorer and alum, Dwayne De Rosario, Joins Chevrolet 🏎️🚘🚙
- 17-Feb-2024 07:00 PM 🚗 All that is New and Unique at the 2024 Canadian International AutoShow
- 16-Feb-2024 07:22 PM 🚗 Excitement Revs High for 2024 Canadian International AutoShow
- 13-Feb-2024 06:49 PM 🚓🏎️💵 National Summit First Step Toward All-Of-Society Approach to End Auto Theft
- 13-Feb-2024 04:23 PM 🧑🔎 FOCAL Research Indicates That Canada Has a Lot at Stake in Transition to Electric Vehicles 🚗🔌
- 13-Feb-2024 12:00 PM 🇨🇦🍁🚓🏎️ Government of Canada hosts National Summit on Combatting Auto Theft 👮💵
- 09-Feb-2024 02:28 PM 🍁🏙️🚋 TORONTO New Measures Speed Up Streetcar Travel on King Street Transit Priority Corridor
- 08-Feb-2024 08:00 AM 🇨🇦🍁🚓🏎️ Government Of Canada Announces Federal Investment to Combat Export of Stolen Vehicles 👮💵
- 21-Dec-2023 12:00 PM 🚗📡 LG Unveils Transparent Antenna for Vehicles with Saint-Gobain Sekurit at Ces 2024
- 17-Nov-2023 12:00 PM 🍁🏙️ JOBS 🧑🔎👩🏫💻 Seneca Polytechnic and Siemens Partner to Provide Tools and Training to the Next Generation of Industry Leaders
- 13-Nov-2023 10:23 AM HOLIDAYS 🎄❄️🎁 TORONTO City of Toronto Announces Lineup for Cavalcade of Lights and Heralds in the Holiday Season With Arrival of the Nathan Phillips Square Christmas Tree
- 04-Nov-2023 02:29 PM 🍁🏙️ City Of Toronto Officially Opens One Yonge Community Recreation Centre on Toronto’S Downtown Waterfront 👥🤝🤗
- 03-Nov-2023 08:00 AM 🍁🏙️ City of Toronto Launches Annual Vision Zero Campaign to Remind Road Users of Reduced Visibility as Clocks Turn Back 🕛🚗
- 16-Oct-2023 08:00 AM 🍁🏙️ Jamaica Travel Expo Brings Island Spirit to Toronto This Fall ✈️🧳
- 11-Oct-2023 04:10 PM 🍁🏙️🧑🔎 Greater Toronto Airports Authority Hosts Major Job Fair for Toronto Pearson at Toronto Congress Centre ✈️
- 15-Aug-2023 02:27 PM 👵🧶🎶🎤 SummerSeries in Trillium Park Hosts Wavelength Summer Thing and Yoga this Weekend - FREE EVENTS
- 11-Aug-2023 08:00 PM TORONTO 🐩City o9f Toronto Reminds Pet Owners to be Responsible, Keep Their Dog Leashed
- 10-Aug-2023 02:19 PM TORONTO 🥘😋❄️City of Toronto Opens Applications for Restaurants to Participate in Winterlicious 2024
- 09-Aug-2023 06:42 PM TORONTO 🏗️ City of Toronto Celebrates the Ground-Breaking of 725 New Rental Homes on City Land at 5207 Dundas Street West
- 09-Aug-2023 12:00 PM TORONTO United Way Greater Toronto Pledges $250,000 to Support African Refugee Claimants and Asylum Seekers; Encourages Public to Meet the Moment
- 29-Jul-2023 02:21 PM TORONTO ☕ World-Renowned Japanese Coffee Brand % Arabica Opens First Downtown Toronto Location
- 28-Jul-2023 04:21 PM TORONTO 🍲🥘✈️ Toronto Pearson Airport Welcomes Osmow's Authentic Mediterranean and Middle Eastern Restaurant to Terminal 1
- 05-Jul-2023 10:27 AM 🚗⚖️ $78 Million Approved for Distribution in Canadian Automotive Parts Price-Fixing Class Action
- 04-Jul-2023 10:23 AM 🚗 BlackBerry Software Is Now Embedded In Over 235 Million Vehicles
- 03-Jul-2023 10:33 AM 🚗 Live Safety Tests Conducted by the Dawn Project Show Tesla Full Self-Driving Running a Stop Sign in Ride-Along With Major Tesla Investor Ross Gerber
- 01-Jul-2023 08:00 AM TORONTO 🍁 City Of Toronto Offering Free Programming Featuring Live Performances, Activities and Fireworks This Canada Day
- 01-Jul-2023 06:00 AM TORONTO 🍁 Happening Now: Spend Canada Day with Parks Canada!
- 20-Jun-2023 10:21 AM TORONTO 👨💻💻 City of Toronto to welcome back Collision Conference in 2024
- 16-Jun-2023 10:21 AM TORONTO JOBS 🎭ACTRA Toronto Partners With Warner Bros. Discovery Access Canada to Launch Permit Access Fund
- 09-Jun-2023 02:25 PM TORONTO 🗿🏺 First-Of-Its-Kind Toronto Holocaust Museum Opens its Doors
- 26-May-2023 01:36 PM Upcoming Event: 🗿🏺 Doors Open Toronto Returns This Weekend
- 26-May-2023 12:10 PM TORONTO City of Toronto Issues 2023 Final Property Tax Bills
- 23-May-2023 02:25 PM TORONTO ✈️🧳 Minister of Transport Announces New Verified Traveller Program to Improve the Security Screening Experience for Eligible Travellers
- 09-May-2023 06:11 PM TORONTO ✈️🧳 Toronto Pearson Gears Up for the Busy Summer Travel Season and Passenger Experience Improvements
- 01-May-2023 10:18 AM TORONTO 🗿🏺 Deputy Mayor Jennifer Mckelvie Proclaims May as Museums Month in Toronto, Announces Full Lineup of Museum Programming
- 30-Apr-2023 04:20 PM TORONTO 🚧🛣️🚋 City Of Toronto Takes Action to Reduce Traffic Congestion Ahead of Metrolinx's Ontario Line Construction on Queen Street Coming May 1
- 19-Apr-2023 10:25 AM TORONTO 🚧🛣️🚋 City Of Toronto Introduces Priority Travel Routes and Takes Action to Reduce Traffic
- 18-Apr-2023 06:13 PM TORONTO City of Toronto Staff Report Recommends Changes to Warming Centre Policies and Procedures
- 18-Apr-2023 02:19 PM TORONTO 🌳🌺 City of Toronto Announces Pollinateto Grant Recipients to Create 110 New Gardens
- 18-Apr-2023 12:00 PM Upcoming Event: ⛵🚢 Toronto Waterfront Festival: The Quack Is Back... Again!
- 18-Apr-2023 10:36 AM TORONTO City of Toronto Expands Traffic Agents Program to Increase Road Safety and Keep Traffic Moving
- 16-Apr-2023 12:00 AM TORONTO 🏠💵 City Of Toronto Launches $21.5 Million Request for Proposals for Multi-Unit Residential
- 14-Apr-2023 02:21 PM TORONTO ☕🏬 City of Toronto Receives More Than 500 Caféto Curb Lane Café Applications
- 14-Apr-2023 12:00 PM TORONTO 🚗🚴🚌 City of Toronto Encourages Residents to Participate in Regional Transportation Planning Survey
- 06-Apr-2023 02:23 PM TORONTO 🚹 City Of Toronto Plans for Early Opening of Seasonal Park Washrooms
- 15-Mar-2023 04:36 PM ONTARIO JOBS 🚗🤖👩💻 Honda Canada Foundation Announces $375,000 Partnership With FIRST Robotics Canada
- 04-Mar-2023 02:21 PM TORONTO 🦷💵📋🏥 Fielding Dental Healthcare Reveals Plans for a 'Healthcare Hub': The First Full-Service Offer of its Kind in The Greater Toronto Area
- 04-Mar-2023 11:14 AM 2023 👩🦼 Accessible Vehicles Bring Freedom. Canadian International Autoshow 2023 (4K HDR, images)
- 04-Mar-2023 10:36 AM 🚗👩🦽 Accessible Vehicles Bring Freedom. Canadian International Autoshow 2023 👩🦽
- 02-Mar-2023 03:01 PM 2023 🚗 The Most Beautiful Cars from $1M to $10M at the Canadian International Autoshow 2023 🏎️🚘🚙 (4K HDR, images)
- 02-Mar-2023 02:10 PM 🚗 2023 Canadian International Autoshow. The Most Beautiful Cars from $1M to $10M
- 27-Feb-2023 04:09 PM 2023 🚗$8.2M CAD Project Arrow Canadian All-electric Concept Debute at the Toronto Autoshow 2023 (4K HDR, images)
- 27-Feb-2023 03:53 PM 🚗 2023 Canadian International Autoshow. $8.2M CAD Project Arrow Canadian All-electric Concept Debute
- 27-Feb-2023 10:08 AM 2023 🚗 $3.5M USD LEGO® TECHNIC Lamborghini Sian at the Canadian International AutoShow 2023 🏎️🚘🚙 (4K HDR, images)
- 27-Feb-2023 09:14 AM 🚗 2023 Canadian International Autoshow. $3.5M USD LEGO® TECHNIC Lamborghini Sian Supercar
- 25-Feb-2023 01:06 PM 2023 🚗 Toyota EX at the Canadian International Autoshow 2023. Six New Toyota Cars Debutes 🏎️🚘🚙 (4K HDR, images)
- 25-Feb-2023 12:12 PM 🚗 2023 Canadian International Autoshow. Toyota EX - New Grand Highlander, Prius, Prius Prime, BZ4X, Tundra and 4Runner TRD PRO Debutes
- 23-Feb-2023 09:15 PM 🚗 2023 Canadian International Autoshow. Lexus RZ 450e and All-New Lexus RX 500h Debutes
- 23-Feb-2023 08:54 PM 2023 🚗 New Lexus RZ 450e and Lexus RX 500h at the Canadian International Autoshow 2023 🏎️🚘🚙 (4K HDR, images)
- 22-Feb-2023 06:03 PM 2023 🚗 Kids Wonderland Walk-through at the Canadian International AutoShow 2023 🏎️🚘🚙 (4K HDR, images)
- 22-Feb-2023 04:42 PM 🚗🧒 2023 Canadian International Autoshow. Kids' Activities - Games, Toys, Play Stations
- 21-Feb-2023 11:37 PM 2023 🚗 Vinfast at the Canadian International Autoshow 2023 🏎️🚘🚙 (4K HDR, images)
- 21-Feb-2023 11:00 PM 🚗🔌 2023 Canadian International Autoshow. Vinfast - a New International Automaker on Canadian Market
- 20-Feb-2023 05:36 PM 2023 🚗 Roshel Senator APC at the Canadian International Autoshow 2023 🏎️🚘🚙 (4K HDR, images)
- 20-Feb-2023 05:00 PM 🚗 NewCa.com Exclusive! 2023 Canadian International Autoshow. Roshel Senator APC
- 19-Feb-2023 08:56 PM 2023 🚓 Ontario Policemen 👮 are the True Stars of the Toronto Autoshow 2023 🏎️🚘🚙 (4K HDR, images)
- 19-Feb-2023 08:03 PM 🚗👮♂️👮 2023 Canadian International Autoshow. Ontario Policemen are the True Stars of the Show
- 18-Feb-2023 10:07 PM 2023 🚗 Stellantis Camp Jeep Experience Exhibit at the Canadian International Auto Show 2023 🏎️🚘🚙 (4K HDR, images)
- 18-Feb-2023 09:00 PM 🚗🔌 2023 Canadian International Autoshow Stellantis Camp Jeep Experience Exhibit
- 17-Feb-2023 12:58 PM 2023 🚗 $3M USD Koenigsegg Regera Hypercar at the Canadian International AutoShow 2023 🏎️🚘🚙 (4K HDR, images)
- 17-Feb-2023 12:10 PM 🚗🔌 2023 Canadian International AutoShow. $3M USD All-New Koenigsegg Regera
- 01-Feb-2023 08:00 AM 🚗🔌 First All-Canadian, Zero-Emission Concept Vehicle Designed in Ontario Unveiled at Consumer Electronics Show
- 30-Jan-2023 10:22 AM 🍁🏙️ PortsToronto Allies with #NotInMyCity and Toronto Police Service to Deliver Human Trafficking Awareness Learning to Billy Bishop Toronto City Airport Staff and Partners 👮👨👧👦👩👩👧👦
- 22-Jan-2023 08:34 PM 🚗🔌💰 New Incentives For Medium- And Heavy-Duty Zero-Emission Vehicles Program
- 01-Dec-2022 06:07 PM 🚗 AutoShow Launches Ticket Sales for 2023 Show
- 29-Feb-2020 08:53 AM 🚗 2020 Canadian International AutoShow. Welcome to the Future of Driving Special Tour
- 29-Feb-2020 08:50 AM 2020 🚗 Canadian International AutoShow. Welcome to the Future of Driving Special Tour 🏎️🚘🚙 (4K, images)
- 26-Feb-2020 09:58 AM 2020 🚗 Canadian International AutoShow. BMW Performance and Electrification 🏎️🚘🚙 (4K, images)
- 25-Feb-2020 10:00 PM 🚗🔌 2020 Canadian International AutoShow. BMW Performance and Electrification
- 24-Feb-2020 12:16 PM 2020 🚗 Canadian International AutoShow. Make Time For Amazing With Lexus 🏎️🚘🚙 (4K, images)
- 24-Feb-2020 12:00 PM 🚗 2020 Canadian International AutoShow. Make Time For Amazing With Lexus
- 23-Feb-2020 10:15 AM 2020 🚗 Canadian International AutoShow. MINI John Cooper Most Powerful Models 🏎️🚘🚙 (4K HDR, images)
- 23-Feb-2020 08:00 AM 🚗 2020 Canadian International AutoShow. MINI John Cooper Most Powerful Models
- 22-Feb-2020 04:46 PM 2020 🚗 Canadian International AutoShow. TOYOTA Electrified 🏎️🚘🚙 (4K, images)
- 22-Feb-2020 12:00 PM 🚗🔌 2020 Canadian International AutoShow. TOYOTA Electrified
- 21-Feb-2020 10:10 AM 2020 🚗 Canadian International AutoShow. 'Transformative Times' Walkthroug 🏎️🚘🚙 (4K, images)
- 21-Feb-2020 08:00 AM 🚗 2020 Canadian International AutoShow. 'Transformative Times' Walkthrough
- 19-Feb-2020 10:18 AM 2020 🚗 Canadian International AutoShow. Honda 'The Intersection' Special Edition 🏎️🚘🚙 (4K, images)
- 19-Feb-2020 08:00 AM 🚗 2020 Canadian International AutoShow. Honda 'The Intersection' Special Edition
- 18-Feb-2020 10:41 AM 2020 🚗 Canadian International AutoShow. Bugatti La Voiture Noire Unveil 🏎️🚘🚙 (4K, images)
- 17-Feb-2020 12:00 PM 🚗 2020 Canadian International AutoShow. Bugatti La Voiture Noire. The World's Most Exclusive Bugatti Unveil
- 16-Feb-2020 09:59 AM 🚗 2020 Canadian International AutoShow. Kids Wonderland Walkthrough
- 16-Feb-2020 09:32 AM 2020 🚗 Canadian International AutoShow. Kids Wonderland Walkthrough 🏎️🚘🚙 (4K, images)
- 15-Feb-2020 10:51 PM 2020 🚗 Canadian International AutoShow. The World’s Largest Pearl 🏎️🚘🚙 (4K, images)
- 15-Feb-2020 10:20 PM 🚗🦪 NewCa.com Exclusive! 2020 Canadian International AutoShow. The World’s Largest Pearl $90+ million USD at the Canadian International AutoShow 2020 (4K HDR)
- 15-Feb-2020 09:06 PM 2020 🚗 Canadian International AutoShow. BMW Back-Up Assistant Demo Special 🏎️🚘🚙 (4K, images)
- 15-Feb-2020 09:06 PM 🚗 NewCa.com Exclusive! 2020 Canadian International AutoShow. BMW Back-Up Assistant Demo Spec
- 15-Feb-2020 08:00 PM 🚗🔌 2020 Canadian International AutoShow. Official Launch of Ivy Charging Network
- 15-Feb-2020 07:51 PM 2020 🚗 Canadian International AutoShow. Official Launch of Ivy Charging Network 🏎️🚘🚙 (4K, images)
- 14-Feb-2020 09:45 AM 🚗 2020 Canadian International AutoShow Toronto. Felino cB7R Canadian Supercar Special
- 14-Feb-2020 04:19 AM 2020 🚗 Canadian International AutoShow Toronto. Felino cB7R Canadian Supercar Special 🏎️🚘🚙 (4K, images)
- 04-Mar-2019 06:38 PM 2019 Canadian International AutoShow. Lowriders Timeless Masterpieces (4K, images)
- 04-Mar-2019 04:10 PM 🚗 NewCa.com Exclusive! 2019 Canadian International AutoShow. Lowriders Timeless Masterpieces
- 28-Feb-2019 09:18 PM 2019 Canadian International AutoShow. BMW Premieres (4K, images)
- 28-Feb-2019 02:45 PM 🚗 2019 Canadian International AutoShow. BMW Premieres
- 26-Feb-2019 08:22 AM 🚗 2019 Canadian International AutoShow. Toyota Premieres
- 26-Feb-2019 06:38 AM 2019 Canadian International AutoShow. Toyota Premieres (4K, images)
- 24-Feb-2019 10:31 AM 🚗 2019 Canadian International AutoShow. Lexus Premieres
- 24-Feb-2019 06:38 AM 2019 Canadian International AutoShow. Lexus Premieres (4K, images)
- 23-Feb-2019 04:39 PM 🚗 2019 Canadian International AutoShow. Genesis Essentia Concept
- 22-Feb-2019 11:30 PM 2019 Canadian International AutoShow. Genesis Essentia Concept (4K, images)
- 21-Feb-2019 09:00 PM 🚗 2019 Canadian International AutoShow. Premieres
- 21-Feb-2019 08:45 PM 2019 Canadian International AutoShow. Premieres (4K, images)
- 21-Feb-2019 09:19 AM Heroes Welcomed at the AutoShow
- 20-Feb-2019 10:10 AM The Future of Mobility
- 19-Feb-2019 06:15 PM 2019 Canadian International Autoshow is Revving Up
- 19-Feb-2019 11:33 AM 2019 Canadian International AutoShow. LEGO® TECHNIC Bugatti Chiron (4K, images)
- 18-Feb-2019 06:34 AM 🚗 2019 Canadian International AutoShow. $3M Bugatti Chiron Hypercar Built From 1M+ LEGO® Technic Pieces
- 17-Feb-2019 03:47 PM 2019 Canadian International AutoShow. Auto Exotica (4K, images)
- 17-Feb-2019 02:53 PM 🚗 2019 Canadian International AutoShow. Auto Exotica
- 16-Feb-2019 07:43 PM 2019 Canadian International AutoShow. Devel Sixteen Hypercar North American Debut (4K, images)
- 16-Feb-2019 05:47 PM 🚗 2019 Canadian International AutoShow. Devel Sixteen North American Debut
- 16-Feb-2019 03:59 PM 2019 Canadian International AutoShow. GO Bus Sweet Ride (4K, images)
- 16-Feb-2019 02:58 PM 🚗 2019 Canadian International AutoShow. GO Bus Sweet Ride
- 16-Feb-2019 08:00 AM 2019 Autoshow. All-New 2020 Mercedes GLE Dancing car
- 15-Feb-2019 10:04 AM Ontario Premier Doug Ford Opens 2019 Canadian International Autoshow
- 14-Feb-2019 06:48 AM 🚗 2019 Canadian International AutoShow. Preview
- 14-Feb-2019 06:39 AM 2019 Canadian International AutoShow. Preparations (4K, images)
- 08-Mar-2018 07:04 PM 2018 AutoShow. All-new 2019 Volvo XC40 R Design Debut at the Canadian International AutoShow (4K, images)
- 08-Mar-2018 07:00 PM 🚗 2018 Canadian International AutoShow. All-new 2019 Volvo XC40 R Design Debut
- 08-Mar-2018 08:00 AM 🚗 2018 Canadian International AutoShow. TOYOTA Mirai FCV
- 08-Mar-2018 07:59 AM 2018 AutoShow. Alternatively Fueled Vehicle Toyota Mirai FCV at the Canadian International AutoShow (4K, images)
- 07-Mar-2018 10:00 AM 🚗 2018 Canadian International AutoShow. Toyota i-TRIL Concept, i-ROAD successor, Unveiling
- 20-Feb-2019 10:10 AM The Future of Mobility
- 05-Mar-2018 06:16 PM 2018 AutoShow. BMW Debuts at the Canadian International AutoShow (4K, images)
- 05-Mar-2018 03:00 PM 🚗 2018 Canadian International AutoShow. BMW X2 Debut
- 05-Mar-2018 02:00 PM 2018 AutoShow. BMW M5 Debuts at the Canadian International AutoShow (4K, images)
- 05-Mar-2018 01:00 PM 🚗 2018 Canadian International AutoShow. BMW M5 Debut
- 05-Mar-2018 10:00 AM 🚗 2018 Canadian International AutoShow. 2019 BMW M4 CS Debut
- 21-Feb-2019 09:19 AM Heroes Welcomed at the AutoShow
- 05-Mar-2018 08:00 AM 🚗 2018 Canadian International AutoShow. BMW i8 Roadster Debut
- 21-Feb-2019 09:00 PM 🚗 2019 Canadian International AutoShow. Premieres
- 04-Mar-2018 01:00 PM 🚗 2018 Canadian International AutoShow. MINI Electric Concept Debut
- 04-Mar-2018 12:33 PM 2018 AutoShow. BMW MC4 Debuts at the Canadian International AutoShow (4K, images)
- 03-Mar-2018 07:00 PM 🚗 2018 Canadian International AutoShow. KIA Niro Plug-in Hybrid Debut
- 03-Mar-2018 10:05 AM 2018 AutoShow. KIA Sorento Debut at the Canadian International AutoShow (4K, images)
- 03-Mar-2018 10:00 AM 🚗 2018 Canadian International AutoShow. 2019 KIA Sorento Debut
- 19-Feb-2019 06:15 PM 2019 Canadian International Autoshow is Revving Up
- 28-Feb-2018 08:40 PM 🚗 2018 Canadian International AutoShow. 2019 Hyundai Veloster N Debut
- 28-Feb-2018 08:05 PM 2018 AutoShow. The All-New 2019 Hyundai Veloster Premiere at the Canadian International AutoShow (4K, images)
- 28-Feb-2018 08:00 PM 🚗 2018 Canadian International AutoShow. 2019 Hyundai Veloster Debut
- 28-Feb-2018 03:28 PM 2018 AutoShow. All-New 2019 Hyundai Veloster Premiere at the Canadian International AutoShow (4K, images)
- 26-Feb-2018 11:00 PM 🚗 2018 Canadian International AutoShow. New Porsche 911 Carrera T Debut
- 17-Feb-2019 02:53 PM 🚗 2019 Canadian International AutoShow. Auto Exotica
- 26-Feb-2018 10:00 PM 🚗 2018 Canadian International AutoShow. Porsche 911 Turbo S Exclusive Series Debut
- 16-Feb-2019 05:47 PM 🚗 2019 Canadian International AutoShow. Devel Sixteen North American Debut
- 26-Feb-2018 09:00 PM 🚗 2018 Canadian International AutoShow. New 2018 Porsche 911 GT2 RS Debut
- 16-Feb-2019 02:58 PM 🚗 2019 Canadian International AutoShow. GO Bus Sweet Ride
- 26-Feb-2018 08:00 PM 🚗 2018 Canadian International AutoShow. Porsche Debuts
- 18-Feb-2019 06:34 AM 🚗 2019 Canadian International AutoShow. $3M Bugatti Chiron Hypercar Built From 1M+ LEGO® Technic Pieces
- 24-Feb-2018 12:05 AM 🚗 2018 Canadian International AutoShow. Mercedes-AMG Project ONE Debut
- 23-Feb-2018 11:00 PM 🚗 2018 Canadian International AutoShow. Mitsubishi Eclipse Cross Unveiling
- 15-Feb-2019 10:04 AM Ontario Premier Doug Ford Opens 2019 Canadian International Autoshow
- 16-Feb-2019 08:00 AM 2019 Autoshow. All-New 2020 Mercedes GLE Dancing car
- 22-Feb-2018 11:01 PM 🚗 2018 Canadian International AutoShow. 2018 Volkswagen Passat GT Concept Debut
- 22-Feb-2018 11:00 PM 🚗 2018 Canadian International AutoShow. Volkswagen Passat GT Concept Unveiling
- 22-Feb-2018 10:01 PM 🚗 2018 Canadian International AutoShow. All-new 2019 Volkswagen Arteon Makes Canadian Debut
- 22-Feb-2018 10:00 PM 🚗 2018 Canadian International AutoShow. All-new 2019 Volkswagen Arteon Unveiling
- 22-Feb-2018 09:00 PM 🚗 2018 Canadian International AutoShow. All-new 2019 Volvo XC40 R Design Unveiling
- 22-Feb-2018 08:01 PM 🚗 2018 Canadian International AutoShow. Infiniti Prototype 9 Concept Debut
- 22-Feb-2018 08:00 PM 🚗 2018 Canadian International AutoShow. Infiniti Prototype 9 Concept Unveiling
- 22-Feb-2018 07:28 PM 2018 AutoShow. Volkswagen Passat GT Concept Unveiling at the Canadian International AutoShow (4K, images)
- 22-Feb-2018 07:20 PM 2018 AutoShow. Volkswagen Arteon Unveiling at the Canadian International AutoShow (4K, images)
- 22-Feb-2018 07:12 PM 2018 AutoShow. Volvo XC40 R Design Unveiling at the Canadian International AutoShow (4K, images)
- 22-Feb-2018 07:01 PM 🚗 2018 Canadian International AutoShow. Infiniti Project Black S Concept Debut
- 22-Feb-2018 07:00 PM 🚗 2018 Canadian International AutoShow. Infiniti Project Black S Concept Unveiling
- 22-Feb-2018 05:02 PM 2018 AutoShow. Infiniti Prototype 9 Concept Unveiling at the Canadian International AutoShow (4K, images)
- 14-Feb-2019 06:48 AM 🚗 2019 Canadian International AutoShow. Preview
- 22-Feb-2018 08:01 AM 🚗 2018 Canadian International AutoShow. Ford Mustang Bullitt Debut
- 22-Feb-2018 08:00 AM 🚗 2018 Canadian International AutoShow. Ford Mustang Bullitt Unveiling
- 22-Feb-2018 07:01 AM 🚗 2018 Canadian International AutoShow. Ford Ranger Debut
- 22-Feb-2018 07:00 AM 🚗 2018 Canadian International AutoShow. Ford Ranger Unveiling
- 22-Feb-2018 06:01 AM 🚗 2018 Canadian International AutoShow. Ford Edge ST Debut
- 22-Feb-2018 06:00 AM 🚗 2018 Canadian International AutoShow. Ford Edge ST Unveiling
- 21-Feb-2018 10:01 PM 🚗 2018 Canadian International AutoShow. GENESIS GV80 Concept Debut
- 21-Feb-2018 10:00 PM 🚗 2018 Canadian International AutoShow. GENESIS GV80 Concept Unveiling
- 21-Feb-2018 09:20 PM 2018 AutoShow. Ford Mustang Bullitt Unveiling at the Canadian International AutoShow (4K, images)
- 21-Feb-2018 09:16 PM 2018 AutoShow. Ford Ranger Unveiling at the Canadian International AutoShow (4K, images)
- 21-Feb-2018 09:12 PM 2018 AutoShow. Ford Edge ST Unveiling at the Canadian International AutoShow (4K, images)
- 21-Feb-2018 08:01 PM 🚗 2018 Canadian International AutoShow. All New Audi A8 Debut
- 21-Feb-2018 08:00 PM 🚗 2018 Canadian International AutoShow. All New Audi A8 Unveiling
- 21-Feb-2018 07:01 PM 🚗 2018 Canadian International AutoShow. The New Audi A7 Sportback Debut
- 21-Feb-2018 07:00 PM 🚗 2018 Canadian International AutoShow. The New Audi A7 Sportback Unveiling
- 21-Feb-2018 03:28 PM 2018 AutoShow. Genesis GV80 Concept Unveiling at the Canadian International AutoShow (4K, images)
- 21-Feb-2018 03:25 PM 2018 AutoShow. All New Audi A8 Unveiling at the Canadian International AutoShow (4K, images)
- 21-Feb-2018 03:23 PM 2018 AutoShow. The new Audi A7 Sportback Unveiling at the Canadian International AutoShow (4K, images)
- 21-Feb-2018 07:00 AM 🚗🔌 2018 Canadian International AutoShow. MINI Electric Concept Unveiling
- 20-Feb-2018 11:00 PM 🚗 2018 Canadian International AutoShow. BMW i8 Roadster Unveiling
- 20-Feb-2018 10:00 PM 🚗 2018 Canadian International AutoShow. 2019 BMW M4 CS Unveiling
- 20-Feb-2018 09:51 PM 2018 AutoShow. MINI Electric Concept Unveiling at the Canadian International AutoShow (4K, images)
- 20-Feb-2018 09:46 PM 2018 AutoShow. The All-New 2019 BMW i8 Roadster Unveiling at the Canadian International AutoShow (4K, images)
- 20-Feb-2018 09:41 PM 2018 AutoShow. 2019 BMW M4 CS Unveiling at the Canadian International AutoShow (4K, images)
- 20-Feb-2018 12:08 PM 2018 AutoShow. 2019 Hyundai Veloster N Unveiling at the Canadian International AutoShow (4K, images)
- 20-Feb-2018 12:05 PM 2018 AutoShow. 2019 Hyundai Veloster Unveiling at the Canadian International AutoShow (4K, images)
- 20-Feb-2018 11:00 AM 🚗 2018 Canadian International AutoShow. 2019 Hyundai Veloster N Unveiling
- 20-Feb-2018 10:00 AM 🚗 2018 Canadian International AutoShow. 2019 Hyundai Veloster Unveiling
- 19-Feb-2018 10:00 PM 🚗 2018 Canadian International AutoShow. Toyota i-TRIL Concept Unveiling
- 19-Feb-2018 08:30 PM 2018 AutoShow. 2019 KIA Sorento Unveiling at the Canadian International AutoShow (4K, images)
- 19-Feb-2018 06:00 PM 🚗 2018 Canadian International AutoShow. 2019 KIA Sorento Unveiling
- 19-Feb-2018 03:00 PM 🚗 2018 Canadian International AutoShow. The New Porsche 911 Carrera T Unveiling
- 19-Feb-2018 02:00 PM 🚗 2018 Canadian International AutoShow. The New Porsche 911 Turbo S Exclusive Series Unveiling
- 19-Feb-2018 01:00 PM 🚗 2018 Canadian International AutoShow. 2018 Porsche 911 GT2 RS Unveiling
- 19-Feb-2018 11:06 AM 2018 AutoShow. New Porsche 911 Carrera T Unveiling at the Canadian International AutoShow (4K, images)
- 19-Feb-2018 11:01 AM 2018 AutoShow. New 2018 Porsche 911 GT2 RS Unveiling at the Canadian International AutoShow (4K, images)
- 19-Feb-2018 10:56 AM 2018 AutoShow. New Porsche 911 Turbo S Exclusive Series Unveiling at the Canadian International AutoShow (4K, images)
- 19-Feb-2018 10:19 AM 2018 AutoShow. Toyota i-TRIL Concept, i-ROAD Successor, Unveiling at the Canadian International AutoShow (4K, images)
- 18-Feb-2018 04:33 PM 2018 AutoShow. Lexus LS+ Concept Debut at the Canadian International AutoShow (4K, images)
- 18-Feb-2018 01:00 AM 🚗 2018 Canadian International AutoShow. Lexus LS Concept Debut
- 16-Feb-2018 11:00 PM 🚗 2018 Canadian International AutoShow. Lexus LS Concept Unveiling
- 16-Feb-2018 08:50 PM 2018 AutoShow. Lexus LS+ Concept Unveiling at the Canadian International AutoShow (4K, images)
- 16-Feb-2018 01:35 PM 2018 AutoShow. Koenigsegg Agera RS Debut at the Canadian International AutoShow (4K, images)
- 16-Feb-2018 05:00 AM 🚗 2018 Canadian International AutoShow. Koenigsegg Agera RS Debut
- 14-Feb-2018 08:17 PM 2018 AutoShow. Lamborghini Urus Debut at the Canadian International AutoShow (4K, images)
- 14-Feb-2018 07:22 PM 2018 AutoShow. Lamborghini Urus Unveiling Canadian International AutoShow (4K, images)
- 14-Feb-2018 05:00 AM 🚗 2018 Canadian International AutoShow. Lamborghini Urus Debut
- 14-Feb-2018 04:00 AM 🚗 2018 Canadian International AutoShow. Lamborghini Urus Unveiling
- 10-Mar-2017 08:20 PM 2017 AutoShow. Toyota Premieres at the Canadian International AutoShow (4K, images)
- 10-Mar-2017 01:00 AM 🚗 2017 Canadian International AutoShow. 2017 Toronto AutoShow. Toyota Premiere
- 28-Feb-2017 09:00 PM 🚗 2017 Canadian International AutoShow. Honda Premieres
- 28-Feb-2017 07:02 PM 2017 AutoShow. Honda Premieres at the Canadian International AutoShow (4K, images)
- 26-Feb-2017 07:05 PM 🚗 2017 Canadian International AutoShow. Record-breaking 2017 AutoShow Draws to Close
- 26-Feb-2017 11:25 AM 2017 AutoShow. Infiniti Qx50 Concept at the Canadian International AutoShow (4K, images)
- 25-Feb-2017 10:00 PM 🚗 2017 Canadian International AutoShow. Infiniti Qx50 Concept
- 22-Feb-2017 06:23 PM 2017 AutoShow. Premieres of the Canadian International AutoShow (4K, images)
- 22-Feb-2017 02:00 PM 🚗 2017 Heroes honoured by Canadian International AutoShow
- 22-Feb-2017 10:00 AM 🚗 2017 Toronto AutoShow Continues to Draw Record Crowds
- 22-Feb-2017 01:11 AM 🚗 2017 Canadian International AutoShow. Premieres
- 08-Mar-2016 03:30 AM 🚗 2016 Canadian International AutoShow. Kia Niro Hybrid Unveiled
- 06-Mar-2016 10:18 PM 2016 AutoShow. Kia Niro Hybrid HUV Unveiled at the Canadian International AutoShow (4K, images)
- 04-Mar-2016 11:33 PM 2016 AutoShow. Kia Sportage Unveiled at the Canadian International AutoShow (4K, images)
- 04-Mar-2016 11:10 PM 🚗 2016 Canadian International AutoShow. 2017 Kia Sportage SUV Unveiled
- 03-Mar-2016 10:05 AM 🚗 2016 Canadian International AutoShow. Alfa Romeo Giulia Unveiled
- 03-Mar-2016 04:14 AM 2016 AutoShow. Alfa Romeo Giulia Unveiled at the Canadian International AutoShow (4K, images)
- 02-Mar-2016 07:41 AM 2016 AutoShow. Nissan Titan Warrior Concept Unveiled at the Canadian International AutoShow (4K, images)
- 01-Mar-2016 11:35 PM 🚗 2016 Canadian International AutoShow. Nissan Titan Warrior Concept
- 24-Feb-2016 10:30 PM 🚗 2016 Canadian International AutoShow. Part 2/2
- 24-Feb-2016 07:27 PM 🚗 2016 Canadian International AutoShow. Part 1/2
- 24-Feb-2016 08:10 AM 2016 AutoShow. Canadian Premieres at the Canadian International AutoShow (Part 2/2) (4K, images)
- 24-Feb-2016 05:47 AM 2016 AutoShow. Canadian Premieres at the Canadian International AutoShow (Part 1/2) (4K, images)
- 22-Feb-2016 08:10 AM 🚗 2016 Canadian International AutoShow. Art and the Automobile
- 22-Feb-2016 06:29 AM 2016 AutoShow. Art and the Automobile at the Canadian International AutoShow (4K, images)
- 21-Feb-2016 04:35 AM 🚗🔌 2016 Canadian International AutoShow. Honda UNI-CUB
- 21-Feb-2016 12:20 AM 🚗 2016 Canadian International AutoShow. 2017 Honda Ridgeline
- 20-Feb-2016 07:38 PM 2016 AutoShow. Honda UNI-CUB at the Canadian International AutoShow (4K, images)
- 19-Feb-2016 09:25 PM 2016 AutoShow. Honda Ridgeline Unveiled at the Canadian International AutoShow (4K, images)
- 18-Feb-2016 07:11 AM 2016 AutoShow. Toyota U2 Concept Unveiled at the Canadian International AutoShow (4K, images)
- 17-Feb-2016 10:20 PM 🚗 2016 Canadian International AutoShow. Toyota U2 Concept
- 17-Feb-2016 07:15 PM 2016 AutoShow. Maserati Quattroporte S Q4 at the Canadian International AutoShow (4K, images)
- 16-Feb-2016 07:53 PM 🚗 2016 Canadian International AutoShow. Maserati Quattroporte S Q4
- 16-Feb-2016 06:58 PM 2016 AutoShow. Tesla Model X Canadian Premiere at the Canadian International AutoShow (4K, images)
- 16-Feb-2016 06:21 PM 🚗 2016 Canadian International AutoShow. Tesla Model X. Canadian Premiere
- 14-Mar-2015 12:15 AM 2015 AutoShow. Chevrolet Bolt EV Concept Canadian Premiere at the Canadian International AutoShow (HD, images)
- 13-Mar-2015 09:46 PM 2015 AutoShow. Chevrolet Volt Canadian Premiere at the Canadian International AutoShow (HD, images)
- 12-Mar-2015 09:20 PM 🚗 2015 Canadian International AutoShow. Canadian Premiere. Chevrolet Bolt EV Concept
- 12-Mar-2015 08:17 PM 🚗 2015 Canadian International AutoShow. Canadian Premiere. 2016 Chevrolet Volt
- 10-Mar-2015 12:05 AM 🚗 2015 Canadian International AutoShow. Canadian Premiere. 2016 Maybach S600
- 09-Mar-2015 05:15 PM 🚗 2015 Canadian International AutoShow. Canadian Premiere. Dodge Charger Hellcat
- 08-Mar-2015 11:52 PM 2015 AutoShow. Maybach S600 Canadian Premiere at the Canadian International AutoShow (HD, images)
- 08-Mar-2015 11:33 PM 2015 AutoShow. Dodge Charger Hellcat Canadian Premieres at the Toronto AutoShow (HD, images)
- 06-Mar-2015 08:00 PM 🚗 2015 Canadian International AutoShow. Canadian Premieres. Hyundai
- 05-Mar-2015 06:55 AM 2015 AutoShow. Hyundai Canadian Premieres at the Canadian International AutoShow (HD, images)
- 02-Mar-2015 08:28 AM 2015 AutoShow. 2015 Kia GT4 Stinger Concept Canadian Premiere at the Canadian International AutoShow (HD, images)
- 02-Mar-2015 08:10 AM 🚗 2015 Canadian International AutoShow. Canadian Premiere. Kia GT4 Stinger Concept
- 01-Mar-2015 04:10 AM 🚗 2015 Canadian International AutoShow. Canadian Premiere. Infiniti Q60 Concept
- 01-Mar-2015 12:10 AM 🚗 2015 Canadian International AutoShow. Canadian Premiere. Infiniti Q80 Inspiration
- 28-Feb-2015 10:49 PM 2015 AutoShow. Infiniti Q60 Concept Canadian Premiere at the Canadian International AutoShow (HD, images)
- 28-Feb-2015 10:37 PM 2015 AutoShow. Infiniti Q80 Inspiration Canadian Premiere at the Canadian International AutoShow (HD, images)
- 25-Feb-2015 05:00 PM 🚗 2015 Canadian International AutoShow. Art and the Automobile. 1867 Steam Buggy
- 25-Feb-2015 01:15 PM 🚗 2015 Canadian International AutoShow. Canadian Premiere. Acura NSX Supercar
- 25-Feb-2015 01:57 AM 2015 AutoShow. Art & the Automobile 1867 Steam Buggy at the Canadian International AutoShow (HD, images)
- 24-Feb-2015 05:47 AM 2015 AutoShow. Acura NSX Supercar Canadian Premiere at the Canadian International AutoShow (HD, images)
- 22-Feb-2015 10:10 PM 🚗 2015 Canadian International AutoShow. Canadian Premiere. 2016 Acura RDX
- 22-Feb-2015 10:06 PM 2015 AutoShow. Acura RDX Canadian Premiere at the Canadian International AutoShow (HD, images)
- 19-Feb-2015 07:02 AM 2015 AutoShow. All-new Honda Pilot Canadian Premiere at the Canadian International AutoShow (HD, images)
- 18-Feb-2015 10:30 PM 🚗 2015 Canadian International AutoShow. Canadian Premiere. 2016 Honda Pilot
- 17-Feb-2015 10:20 PM 🚗 2015 Canadian International AutoShow. Canadian Premiere. Scion iM Concept
- 17-Feb-2015 08:04 PM 2015 AutoShow. Scion iM Concept Canadian Premiere at the Canadian International AutoShow (HD, images)
- 17-Feb-2015 06:24 AM 2015 AutoShow. Toyota i-Road Concept Canadian Premiere at the Canadian International AutoShow (HD, images)
- 16-Feb-2015 10:45 PM 🚗 2015 Canadian International AutoShow. Canadian Premiere. Toyota i-Road Concept
- 16-Feb-2015 12:55 AM 2015 AutoShow. Lexus RC F GT3 Concept Canadian Premiere at the Canadian International AutoShow (HD, images)
- 15-Feb-2015 08:45 PM 🚗 2015 Canadian International AutoShow. Lexus RC F GT3 concept
- 15-Feb-2015 08:42 PM 🚗 2015 Canadian International AutoShow. From Stunning Concepts To Engaging Activities
- 15-Feb-2015 07:30 PM 🚗 2015 Canadian International AutoShow. Family Day is February 16
- 13-Feb-2015 04:13 PM 🚗 2015 Canadian International AutoShow. Джо Оливер и Джон Тори открыли Автошоу
- 13-Feb-2015 12:35 PM 2015 AutoShow. Auto Exotica – одна из жемчужин шоу (images)
- 13-Feb-2015 12:30 PM 🚗 2015 Canadian International AutoShow. Auto Exotica – одна из жемчужин шоу
- 13-Feb-2015 08:16 AM 🚗 2015 Canadian International AutoShow. Шоу открывается сегодня
- 21-Feb-2014 08:00 AM 🚗 2014 Canadian International AutoShow. Premieres. Nissan Sentra NISMO concept
- 21-Feb-2014 01:06 AM 2014 AutoShow. Nissan Sentra NISMO Concept Debut at the Canadian International AutoShow (HD, images)
- 20-Feb-2014 09:57 PM 2014 AutoShow. Honda Fit Premieres at the Canadian International AutoShow (HD, images)
- 20-Feb-2014 07:00 AM 🚗 2014 Canadian International AutoShow. Premieres. 2015 Honda Fit
- 18-Feb-2014 11:14 PM 2014 AutoShow. Nissan Micra Premiere at the Canadian International AutoShow (HD, images)
- 18-Feb-2014 08:00 AM 🚗 2014 Canadian International AutoShow. Premieres. Toyota FV2 Concept
- 17-Feb-2014 11:34 PM 2014 AutoShow. Toyota FV2 Concept Premiere at the Toronto AutoShow (HD, images)
- 17-Feb-2014 02:03 AM 2014 AutoShow. Infiniti Q30 Premiere at the Canadian International AutoShow (HD, images)
- 14-Feb-2014 01:00 PM 🚗 2014 Canadian International AutoShow. Premieres. Infiniti Q30
- 04-Mar-2013 10:49 PM 2013 AutoShow. Concepts Debuts at the Canadian International AutoShow (HD, images)
- 04-Mar-2013 10:01 PM 🚗 2013 Canadian International AutoShow. Concepts Debuts
- 01-Mar-2013 10:44 AM 🚗 2013 Canadian International AutoShow. Canadian Premieres
- 08-Mar-2018 07:00 PM 🚗 2018 Canadian International AutoShow. All-new 2019 Volvo XC40 R Design Debut
- 26-Feb-2013 05:09 PM 🚗 2013 Canadian International AutoShow. Nissan Canadian Premieres
- 05-Mar-2018 08:00 AM 🚗 2018 Canadian International AutoShow. BMW i8 Roadster Debut
- 08-Mar-2018 08:00 AM 🚗 2018 Canadian International AutoShow. TOYOTA Mirai FCV
- 25-Feb-2013 09:16 AM 🚗 2013 Canadian International AutoShow. Nissan NV2500 HD
- 25-Feb-2013 06:44 AM 🚗 2013 Canadian International AutoShow. Nissan NV200 Compact Cargo. Canadian Premiere
- 04-Mar-2018 01:00 PM 🚗 2018 Canadian International AutoShow. MINI Electric Concept Debut
- 07-Mar-2018 10:00 AM 🚗 2018 Canadian International AutoShow. Toyota i-TRIL Concept, i-ROAD successor, Unveiling
- 24-Feb-2013 10:19 AM 🚗 2013 Canadian International AutoShow. BMW i8 Coupe Concept. Canadian Premiere
- 24-Feb-2013 09:14 AM 🚗 2013 Canadian International AutoShow. BMW i3 Coupe Concept. Canadian Premiere
- 05-Mar-2018 03:00 PM 🚗 2018 Canadian International AutoShow. BMW X2 Debut
- 05-Mar-2018 01:00 PM 🚗 2018 Canadian International AutoShow. BMW M5 Debut
- 23-Feb-2013 05:07 AM 🚗 2013 Canadian International AutoShow. Hyundai HCD-14 Genesis Concept. Canadian Premiere
- 05-Mar-2018 10:00 AM 🚗 2018 Canadian International AutoShow. 2019 BMW M4 CS Debut
- 22-Feb-2013 04:01 PM 🚗 2013 Canadian International AutoShow. Linkoln MKC Concept. Canadian Premiere
- 21-Feb-2013 10:58 PM 🚗 2013 Canadian International AutoShow. 2014 Nissan Versa Note. Canadian Premiere
- 03-Mar-2018 07:00 PM 🚗 2018 Canadian International AutoShow. KIA Niro Plug-in Hybrid Debut
- 03-Mar-2018 10:00 AM 🚗 2018 Canadian International AutoShow. 2019 KIA Sorento Debut
- 21-Feb-2013 04:57 PM 🚗 2013 Canadian International AutoShow. 2014 Nissan Juke Nismo. Canadian Premiere
- 28-Feb-2018 08:00 PM 🚗 2018 Canadian International AutoShow. 2019 Hyundai Veloster Debut
- 20-Feb-2013 08:28 PM 🚗 2013 Canadian International AutoShow. Nissan Resonance Concept. Canadian Premiere
- 28-Feb-2018 08:40 PM 🚗 2018 Canadian International AutoShow. 2019 Hyundai Veloster N Debut
- 20-Feb-2013 12:55 AM 🚗 2013 Canadian International AutoShow. Honda Urban SUV Concept. Canadian Premiere
- 26-Feb-2018 11:00 PM 🚗 2018 Canadian International AutoShow. New Porsche 911 Carrera T Debut
- 19-Feb-2013 05:20 PM 🚗 2013 Canadian International AutoShow. Acura NSX Concept. Canadian Premiere
- 18-Feb-2013 11:40 PM 🚗 2013 Canadian International AutoShow. Toyota Fun-Vii Concept. Canadian Premiere
- 26-Feb-2018 10:00 PM 🚗 2018 Canadian International AutoShow. Porsche 911 Turbo S Exclusive Series Debut
- 26-Feb-2018 09:00 PM 🚗 2018 Canadian International AutoShow. New 2018 Porsche 911 GT2 RS Debut
- 26-Feb-2018 08:00 PM 🚗 2018 Canadian International AutoShow. Porsche Debuts
- 24-Feb-2018 12:05 AM 🚗 2018 Canadian International AutoShow. Mercedes-AMG Project ONE Debut
- 18-Feb-2013 08:45 AM 🚗 2013 Canadian International AutoShow. Lexus IS
- 17-Feb-2013 11:54 PM 🚗 2013 Canadian International AutoShow. Lexus LF-CC Concept. Canadian Premiere
- 17-Feb-2013 08:21 PM 🚗 2013 Canadian International AutoShow.Lexus LF-LC Concept. Canadian Premiere
- 16-Feb-2013 10:07 PM 🚗 2013 Canadian International AutoShow. Opening Ceremony
- 23-Feb-2018 11:00 PM 🚗 2018 Canadian International AutoShow. Mitsubishi Eclipse Cross Unveiling
- 22-Feb-2018 11:00 PM 🚗 2018 Canadian International AutoShow. Volkswagen Passat GT Concept Unveiling
- 15-Feb-2013 11:21 AM 🚗 2013 Canadian AutoShow. Infiniti Q50 feat. Cirque Du Soleil
- 07-Mar-2012 08:43 PM 2012 AutoShow. Volkswagen Bulli Concept at the Canadian International AutoShow (HD, images)
- 07-Mar-2012 06:01 PM 🚗 2012 Canadian International AutoShow. Volkswagen Bulli Concept
- 01-Mar-2012 12:07 AM 🚗 2012 Canadian International Autoshow. BMW Vision ConnectedDrive Concept
- 29-Feb-2012 09:16 PM 2012 AutoShow. BMW Vision ConnectedDrive at the Canadian International AutoShow (HD, images)
- 08-Mar-2016 03:30 AM 🚗 2016 Canadian International AutoShow. Kia Niro Hybrid Unveiled
- 27-Feb-2012 11:17 PM 🚗 2012 Canadian International Auto Show. 2013 Dodge Dart and 2013 Mopar Dodge Dart GTS Turbo
- 27-Feb-2012 07:21 AM 🚗 2012 Canadian International Auto Show. 2013 Subaru XV
- 04-Mar-2016 11:10 PM 🚗 2016 Canadian International AutoShow. 2017 Kia Sportage SUV Unveiled
- 03-Mar-2016 10:05 AM 🚗 2016 Canadian International AutoShow. Alfa Romeo Giulia Unveiled
- 24-Feb-2012 07:11 PM 🚗 2012 Canadian International Auto Show. 2013 Lincoln MKZ Concept
- 23-Feb-2012 11:07 AM 🚗 2012 Canadian International Auto Show. 2013 Nissan GT-R
- 01-Mar-2016 11:35 PM 🚗 2016 Canadian International AutoShow. Nissan Titan Warrior Concept
- 24-Feb-2016 10:30 PM 🚗 2016 Canadian International AutoShow. Part 2/2
- 22-Feb-2012 05:48 PM 🚗 2012 Canadian International Autoshow. Nissan e-NV200 Concept
- 22-Feb-2012 07:23 AM 🚗 2012 Canadian International Autoshow. 2013 Acura ILX Luxury Compact Sport
- 24-Feb-2016 07:27 PM 🚗 2016 Canadian International AutoShow. Part 1/2
- 21-Feb-2012 09:56 PM 🚗 2012 Canadian International Auto Show. 2013 Honda Accord Coupe Concept 2012
- 22-Feb-2016 08:10 AM 🚗 2016 Canadian International AutoShow. Art and the Automobile
- 20-Feb-2012 11:51 PM 🚗 2012 Canadian International Autoshow. Mini Inspired by Goodwood Premiere
- 21-Feb-2016 04:35 AM 🚗🔌 2016 Canadian International AutoShow. Honda UNI-CUB
- 20-Feb-2012 01:02 PM 🚗 2012 Canadian International AutoShow. The Canadian Vehicle Premieres
- 21-Feb-2016 12:20 AM 🚗 2016 Canadian International AutoShow. 2017 Honda Ridgeline
- 19-Feb-2012 07:04 PM 🚗 2012 Canadian International Autoshow. Infiniti Etherea Concept Premiere feat. Cirque Du Soleil
- 17-Feb-2016 10:20 PM 🚗 2016 Canadian International AutoShow. Toyota U2 Concept
- 16-Feb-2016 07:53 PM 🚗 2016 Canadian International AutoShow. Maserati Quattroporte S Q4
- 17-Feb-2012 10:02 PM 🚗 2012 Canadian International Autoshow. McLaren MP4-12C
- 17-Feb-2012 09:56 PM 🚗 2012 Canadian International Autoshow. 2013 Acura NSX Concept
- 16-Feb-2016 06:21 PM 🚗 2016 Canadian International AutoShow. Tesla Model X. Canadian Premiere
- 15-Feb-2015 08:45 PM 🚗 2015 Canadian International AutoShow. Lexus RC F GT3 concept
- 11-Mar-2011 12:55 PM 🚗 2011 Canadian International AutoShow. Honda Canadian Premieres
- 01-Mar-2011 11:21 PM 🚗 2011 Canadian International AutoShow. GM launched four new Chevrolet this year
- 01-Mar-2011 06:00 PM 🚗 2011 Canadian International AutoShow. 2012 Buick Verano
- 15-Feb-2015 07:30 PM 🚗 2015 Canadian International AutoShow. Family Day is February 16
- 13-Feb-2015 04:13 PM 🚗 2015 Canadian International AutoShow. Джо Оливер и Джон Тори открыли Автошоу
- 27-Feb-2011 08:00 PM 🚗 2011 Canadian International AutoShow. Chevrolet Cruze - "Car of the Year 2011"
- 13-Feb-2015 12:30 PM 🚗 2015 Canadian International AutoShow. Auto Exotica – одна из жемчужин шоу
- 13-Feb-2015 08:16 AM 🚗 2015 Canadian International AutoShow. Шоу открывается сегодня
- 27-Feb-2011 12:36 AM 🚗 2011 Canadian International AutoShow. Nissan Leaf. Canadian Premiere
- 24-Feb-2011 11:00 AM 2011 AutoShow. Nissan Ellure Concept Canadian Debut at the Canadian International AutoShow (HD, images)
- 24-Feb-2011 08:37 AM 🚗 2011 Canadian International AutoShow. Nissan Ellure Concept. Canadian Premiere
- 23-Feb-2011 09:25 PM 2011 AutoShow. Concorso Exotica at the Canadian International AutoShow (HD, images)
- 23-Feb-2011 09:07 PM 🚗 2011 Canadian International AutoShow. Concorso Exotica
- 21-Feb-2011 01:50 AM 2011 AutoShow. Canadian premieres at the Toronto AutoShow (HD, images)
- 20-Feb-2011 08:30 PM 🚗 2011 Canadian International AutoShow. Canadian Premieres #2
- 20-Feb-2011 12:29 PM 2011 AutoShow. Canadian Premieres of the Canadian International AutoShow (HD, images)
- 20-Feb-2011 12:05 PM 🚗 2011 Canadian International AutoShow. Canadian Premieres #1
- 19-Feb-2011 12:23 PM 🚗 2011 Canadian International AutoShow. Canadian Premiere - Nissan Quest
- 19-Feb-2011 11:37 AM 2011 AutoShow. Nissan Quest Canadian Premiere at the Canadian International AutoShow (HD, images)
- 19-Feb-2010 04:59 AM 🚗 2010 Canadian International AutoShow. Lincoln C Concept. Canadian Premiere
- 19-Feb-2010 12:00 AM 2010 AutoShow. Lincoln C Concept Canadian Premiere at the Canadian International AutoShow (HD, images)
- 18-Feb-2010 10:05 PM 2010 AutoShow. Ford Focus Canadian Premiere at the Canadian International AutoShow (HD, images)
- 18-Feb-2010 10:01 PM 🚗 2010 Canadian International AutoShow. 2012 Ford Focus. Canadian Premiere
- 18-Feb-2010 01:12 AM 2010 AutoShow. Hyundai Sonata Canadian Premiere at the Toronto AutoShow (HD, images)
- 18-Feb-2010 12:51 AM 2010 AutoShow. Hyundai Nuvis Concept Canadian Premiere at the Canadian International AutoShow (HD, images)
- 18-Feb-2010 12:03 AM 🚗 2010 Canadian International AutoShow. 2011 Hyundai Sonata. Canadian Premiere
- 17-Feb-2010 07:50 PM 🚗 2010 Canadian International AutoShow. Hyundai Nuvis Concept. Canadian Premiere
- 16-Feb-2010 10:51 PM 2010 AutoShow. GM Canadian Premieres at the Canadian International AutoShow (HD, images)
- 16-Feb-2010 09:01 PM 🚗 2010 Canadian International AutoShow. GM Premieres
- 16-Feb-2010 11:30 AM 2010 AutoShow. Fiat 500 Canadian Premiere at the Canadian International AutoShow (HD, images)
- 16-Feb-2010 04:01 AM 🚗 2010 Canadian International AutoShow. Fiat 500. Canadian Premiere
- 15-Feb-2010 10:51 PM 2010 AutoShow. Mini Beachcomber Concept Debut at the Canadian International AutoShow (HD, images)
- 15-Feb-2010 09:04 PM 🚗 2010 Canadian International AutoShow. MINI Beachcomber Concept
- 13-Feb-2010 09:38 AM 2010 AutoShow. Plethore LC-750 - 1st Canadian Supercar at the Canadian International AutoShow (HD, images)
- 13-Feb-2010 08:07 AM 🚗 2010 Canadian International AutoShow. HTT Plethore LC-750. Canadian Premiere
- 12-Feb-2010 09:23 AM 🚗 2010 Canadian International AutoShow. Cirque du Soleil Car
- 12-Feb-2010 12:31 AM 2010 AutoShow. Cirque du Soleil Car at the Canadian International AutoShow (HD, images)
- 16-Mar-2009 05:05 AM 🚗 2009 Canadian International AutoShow. 2010 Mazda CX-7 World Premiere
- 14-Mar-2009 01:49 AM 🚗 2009 Canadian International AutoShow. 2009 Mazda MX-5
- 10-Mar-2009 02:28 AM 🚗 2009 Canadian International AutoShow. NASCAR Pavilion
- 08-Mar-2009 01:05 AM 🚗 2009 Canadian International AutoShow. Mercedes-Benz SL65 AMG Black Series - Canadian Premiere
- 07-Mar-2009 06:01 PM 🚗 2009 Canadian International AutoShow. 2010 Mercedes-Benz GLK 350 4Matic - Canadian Premiere
- 06-Mar-2009 07:35 AM 🚗 2009 Canadian International AutoShow. BMW Z4 2009. Canadian Premiere
- 06-Mar-2009 12:32 AM 🚗 2009 Canadian International AutoShow. BMW Concept 7 Series ActiveHybrid
- 05-Mar-2009 05:59 PM 🚗 2009 Canadian International AutoShow. Honda FC Sport Concept
- 04-Mar-2009 01:30 AM 🚗 2009 Canadian International AutoShow. 2010 Kia Forte. Canadian Premiere
- 02-Mar-2009 02:32 PM 🚗 2009 Canadian International AutoShow. Ferrari Scuderia Spider 16 M. Canadian Premiere
- 02-Mar-2009 11:29 AM 🚗 2009 Canadian International AutoShow. Maserati Quatroporte Sport GT S. Canadian Premiere
- 01-Mar-2009 01:40 PM 🚗 2009 Canadian International AutoShow. Scion FUSE
- 20-Feb-2009 01:45 PM 2009 AutoShow. NASCAR Pavilion at the Canadian International AutoShow (HD, images)
- 20-Feb-2009 01:45 PM 2009 AutoShow. Mercedes-Benz Canadian Premieres at the Canadian International AutoShow (HD, images)
- 20-Feb-2009 01:45 PM 2009 AutoShow. Mazda CX-7 World Premiere at the Canadian International AutoShow (HD, images)
- 20-Feb-2009 01:45 PM 2009 AutoShow. Kia Forte Canadian Premiere at the Canadian International AutoShow (HD, images)
- 20-Feb-2009 01:45 PM 2009 AutoShow. Hi-End Cars at the Canadian International AutoShow (HD, images)
- 20-Feb-2009 01:45 PM 2009 AutoShow. Ferrari-Maserati Canadian Premiere at the Canadian International AutoShow (HD, images)
- 20-Feb-2009 01:45 PM 2009 AutoShow. BMW Z4 Canadian Premiere at the Canadian International AutoShow (HD, images)
- 20-Feb-2009 01:45 PM 2009 AutoShow. BMW Concept 7 Series Active Hybrid at the Canadian International AutoShow (HD, images)
- 20-Feb-2009 01:45 PM 2009 AutoShow. Scion Fuse Concept Premiere at the Canadian International AutoShow (HD, images)
- 20-Feb-2009 01:45 PM 2009 AutoShow. Mazda MX-5 Debut at the Canadian International AutoShow (HD, images)
- 20-Feb-2009 01:45 PM 2009 AutoShow. Honda FC Sport Concept Debut at the Canadian International AutoShow (HD, images)
- 20-Feb-2009 01:45 PM 2009 AutoShow. Maybach at the Canadian International AutoShow (HD, images)
- 20-Feb-2009 01:45 PM 2009 AutoShow. Mercedes SLR at the Canadian International AutoShow (HD, images)
- 20-Feb-2009 01:45 PM 2009 AutoShow. Smart at the Canadian International AutoShow (HD, images)
- 20-Feb-2009 01:45 PM 2009 AutoShow. 2010 Mercedes-Benz GLK 350 4Matic - Canadian Premiereat the Canadian International AutoShow (HD, images)
- 20-Feb-2009 01:45 PM 2009 AutoShow. Hi-ENd Cars #4 (Aston Martin, Bentley, Lotus, Rolls Royce) (HD, images)
- 20-Feb-2009 01:45 PM 2009 AutoShow. Hi-ENd Cars #3 (Lamborgini) at the Canadian International AutoShow (HD, images)
- 20-Feb-2009 01:45 PM 2009 AutoShow. Nissan 370Z at the Canadian International AutoShow (HD, images)
- 20-Feb-2009 09:51 AM 🚗 2009 Canadian International AutoShow. 2009 Nissan GT-R
- 20-Feb-2009 05:49 AM 🚗 2009 Canadian International AutoShow. 2010 Jaguar XFR: Sporting Luxury – Canadian Premiere
- 20-Feb-2009 04:22 AM 🚗 2009 Canadian International AutoShow. 2009 Jaguar XF
- 20-Feb-2009 12:45 AM 🚗 2009 Canadian International AutoShow. 2009 Mitsubishi iMiEV Сoncept
- 18-Feb-2009 08:58 AM 🚗 2009 Canadian International AutoShow. Hybrid Lexus: HS 250h Canadian Premiere
- 18-Feb-2009 12:55 AM 🚗 2009 Canadian International AutoShow. 2009 Toyota Venza
- 17-Feb-2009 08:04 PM 🚗 2009 Canadian International AutoShow. 2010 Toyota Prius Hybrid Canadian Premiere
- 17-Feb-2009 08:47 AM 🚗 2009 Canadian International AutoShow. Canadian Forces
- 17-Feb-2009 08:37 AM 2009 AutoShow. Jaguar XFR: Luxury Sports Car Canadian Premiere at the Canadian International AutoShow (HD, images)
- 17-Feb-2009 08:37 AM 2009 AutoShow. Mitsubishi iMiEV Concept at the Canadian International AutoShow (HD, images)
- 17-Feb-2009 08:37 AM 2009 AutoShow. Lexus Hybrid: HS 250h Canadian Premiere at the Canadian International AutoShow (HD, images)
- 17-Feb-2009 08:37 AM 2009 AutoShow. Toyota Venza Debut at the Canadian International AutoShow (HD, images)
- 17-Feb-2009 08:37 AM 2009 AutoShow. Toyota Prius Hybrid Canadian Premiere at the Canadian International AutoShow (HD, images)
- 17-Feb-2009 08:37 AM 2009 AutoShow. Cruise Nationals #2 at the Canadian International AutoShow (HD, images)
- 17-Feb-2009 08:36 AM 2009 AutoShow. Canadian Forces at the Canadian International AutoShow (HD, images)
- 17-Feb-2009 08:36 AM 2009 AutoShow. Cruise Nationals #1 at the Canadian International AutoShow (HD, images)
- 16-Feb-2009 08:20 PM 🚗 2009 Canadian International AutoShow. Cruise Nationals
- 16-Feb-2009 03:38 PM 2009 AutoShow. Corvette! An American Legend at the Canadian International AutoShow (HD, images)
- 16-Feb-2009 02:26 PM 🚗 2009 Canadian International AutoShow. Corvette! An American Legend
- 15-Feb-2009 03:19 AM 🚗 2009 Canadian International AutoShow. Pfaff Tuning
- 13-Feb-2009 12:03 PM 🚗 2009 Canadian International AutoShow. North American Premiers
- 12-Feb-2009 09:06 PM 2009 AutoShow. PFAFF Tuning Ex at the Canadian International AutoShow (HD, images)
- 12-Feb-2009 09:06 PM 2009 AutoShow. Nissan GT-R debut at the Canadian International AutoShow (HD, images)
- 12-Feb-2009 09:06 PM 2009 AutoShow. Nissan Forum Concept at the Canadian International AutoShow (HD, images)
- 12-Feb-2009 09:06 PM 2009 AutoShow. North American Premieres at the Canadian International AutoShow (HD, images)
- 12-Feb-2009 09:02 PM 🚗 2009 Canadian International AutoShow. Nissan Forum Concept
- 12-Feb-2009 03:08 PM 2009 AutoShow. Nissan Cube at the Canadian International AutoShow (HD, images)
- 12-Feb-2009 12:07 PM 🚗 2009 Canadian International AutoShow. Nissan Cube
- 12-Feb-2009 10:56 AM 2009 AutoShow. Nissan NV 2500 Concept – The World Premiere at the Canadian International AutoShow (HD, images)
- 12-Feb-2009 08:55 AM 🚗 2009 Canadian International AutoShow. Nissan NV 2500 Concept World Premiere
- 24-Feb-2008 11:03 PM 2008 🚘 AutoShow : Toyota Hybrid Х, Toyota i-REAL at the Canadian International AutoShow (SD, images)
- 24-Feb-2008 10:02 PM 🚗 2008 Canadian International Autoshow. Toyota Hybrid Х, Toyota i-REAL
- 14-Mar-2009 01:49 AM 🚗 2009 Canadian International AutoShow. 2009 Mazda MX-5
- 10-Mar-2009 02:28 AM 🚗 2009 Canadian International AutoShow. NASCAR Pavilion
- 19-Feb-2008 08:46 PM 🚗 2008 Canadian International Autoshow. Classics Concourse
- 08-Mar-2009 01:05 AM 🚗 2009 Canadian International AutoShow. Mercedes-Benz SL65 AMG Black Series - Canadian Premiere
- 15-Feb-2008 10:39 PM 🚗 2008 Canadian International Autoshow. Факты
- 07-Mar-2009 06:01 PM 🚗 2009 Canadian International AutoShow. 2010 Mercedes-Benz GLK 350 4Matic - Canadian Premiere
- 05-Mar-2009 05:59 PM 🚗 2009 Canadian International AutoShow. Honda FC Sport Concept
- 15-Feb-2008 10:36 AM 🚗 2008 Canadian International Autoshow. Премьеры
- 06-Mar-2009 07:35 AM 🚗 2009 Canadian International AutoShow. BMW Z4 2009. Canadian Premiere
- 14-Feb-2008 09:26 PM 🚗 2008 Canadian International Autoshow. Автосалон в Торонто представляет новые концепты
- 06-Mar-2009 12:32 AM 🚗 2009 Canadian International AutoShow. BMW Concept 7 Series ActiveHybrid
- 14-Feb-2008 08:35 AM 🚗 2008 Canadian International Autoshow. 33-е Канадское Международное Автошоу в Торонто
- 28-Feb-2007 03:50 PM 🚗 2007 Canadian International Autoshow. Автосалон в Торонто Представляет Новые Концепты #2
- 27-Feb-2007 11:44 PM 2007 🚘 Canadian International AutoShow : Concept Cars (images)
- 27-Feb-2007 09:45 PM 🚗 2007 Canadian International Autoshow. Автосалон в Торонто Представляет Новые Концепты #1
- 18-Feb-2007 04:57 PM 🚗 2007 Canadian International Autoshow. Studebaker «Different by Design»
- 18-Feb-2007 03:56 PM 🚗 2007 Canadian International Autoshow. Studebaker – легенда американского автопрома в Торонто
- 18-Feb-2007 08:38 AM 2007 🚘 Canadian International AutoShow : Motorcycle World (images)
- 18-Feb-2007 05:33 AM 2007 🚘 Canadian International AutoShow : Studebaker «Different by Design» (images)
- 18-Feb-2007 02:43 AM 2007 🚘 Canadian International AutoShow : Classic Concourse (images)
- 18-Feb-2007 01:32 AM 2007 🚘 Canadian International AutoShow : Career Design (images)
- 18-Feb-2007 01:26 AM 🚗 2007 Canadian International Autoshow. Солнечный свет – на службу человеку
- 16-Feb-2007 09:36 PM 🚗 2007 Canadian International Autoshow. Как провести с пользой время на автошоу. Советы экспертов
- 14-Feb-2007 08:41 AM 🚗 2007 Canadian International Autoshow. Факты Канадского Международного Автошоу
- 14-Feb-2007 12:38 AM 🚗 2007 Canadian International Autoshow. 34-е Канадское Международное Автошоу в Торонто
- 28-Feb-2006 03:12 PM 2006 🚘 AutoShow. Suzuki PX Concept in a Retro Style at the Canadian International AutoShow (SD, images)
- 27-Feb-2006 03:12 PM 2006 🚘 AutoShow. Mazda Senku Magic in a Wheels at the Canadian International AutoShow (SD, images)
- 26-Feb-2006 03:12 PM 2006 🚘 Canadian International AutoShow (Toronto) - Concepts #2 (images)
- 26-Feb-2006 03:11 PM 2006 🚘 Canadian International AutoShow (Toronto) - Concepts #1 (images)
- 26-Feb-2006 03:05 PM 2006 🚘 Canadian International AutoShow (Toronto) - The Best Cars #5 (images)
- 26-Feb-2006 03:04 PM 2006 🚘 Canadian International AutoShow (Toronto) - The Best Cars #4 (images)
- 26-Feb-2006 03:03 PM 2006 🚘 Canadian International AutoShow (Toronto) - The Best Cars #3 (images)
- 26-Feb-2006 03:02 PM 2006 🚘 Canadian International AutoShow (Toronto) - The Best Cars #2 (images)
- 26-Feb-2006 03:01 PM 2006 🚘 Canadian International AutoShow (Toronto) - The Best Cars #1 (images)
- 26-Feb-2006 02:54 PM 2006 🚘 Canadian International AutoShow (Toronto) - Studebaker Collection (images)
- 26-Feb-2006 02:52 PM 2006 🚘 Canadian International AutoShow (Toronto) - Hi-End Cars (images)
- 26-Feb-2006 02:51 PM 2006 🚘 Canadian International AutoShow (Toronto) - The Bikes (images)
- 26-Feb-2006 02:40 PM 2006 🚘 Canadian International AutoShow (Toronto) - Classics Salon #2 (images)
- 26-Feb-2006 02:30 PM 2006 🚘 Canadian International AutoShow (Toronto) - Classics Salon #1 (images)
- 26-Feb-2006 02:20 PM 2006 🚘 Canadian International AutoShow (Toronto) - Awards (images)
- 26-Feb-2006 02:10 PM 2006 🚘 AutoShow. Canadian Army Ex at the Canadian International AutoShow (Toronto) (images)
- 26-Feb-2006 01:57 PM 2006 🚘 Canadian International AutoShow (Toronto) - New Car 2007 (images)
- 26-Feb-2006 01:28 PM 🚗 2006 Canadian International Autoshow. Suzuki PX - концепт в стиле ретро
- 26-Feb-2006 01:57 PM 2006 🚘 Canadian International AutoShow (Toronto) - New Car 2007 (images)
- 20-Feb-2006 01:22 PM 🚗 2006 Canadian International Autoshow. Как провести с пользой время на автошоу. Советы экспертов
- 15-Feb-2006 01:22 PM 🚗 2006 Canadian International AutoShow. 33-е Канадское Международное Автошоу в Торонто
- 10-Mar-2005 01:18 PM 2005 🚔 Canadian International AutoShow #32 (Toronto) - Concept Cars (images)
- 14-Feb-2007 12:38 AM 🚗 2007 Canadian International Autoshow. 34-е Канадское Международное Автошоу в Торонто
- 10-Mar-2005 01:18 PM 2005 🚔 AutoShow. Rare Cars Exhibition at the Canadian International AutoShow #2 (images)
- 18-Feb-2007 01:26 AM 🚗 2007 Canadian International Autoshow. Солнечный свет – на службу человеку
- 08-Mar-2005 05:23 PM 2005 🚔 AutoShow. The Best Cars at the Canadian International AutoShow #2 (images)
- 08-Mar-2005 01:31 PM 2005 🚔 AutoShow. The Best Cars at the Canadian International AutoShow #1 (images)
- 07-Mar-2005 11:06 PM 2005 AutoShow. Concept Cars at the Canadian International AutoShow (images)
- 15-Feb-2008 10:36 AM 🚗 2008 Canadian International Autoshow. Премьеры
- 07-Mar-2005 05:21 AM 🚗 2005 Canadian International Autoshow. «Салют Роллс-Ройсу» - экспозиция, посвященная столетнему юбилею Rolls-Royce
- 07-Mar-2005 05:21 AM 2005 🚔 AutoShow. Rolls-Royce Collection at the Canadian International AutoShow (images)
- 10-Mar-2005 01:18 PM 2005 🚔 Canadian International AutoShow #32 (Toronto) - Concept Cars (images)
- 28-Feb-2004 08:21 PM 2004 🚘 Canadian International AutoShow #31 (Toronto) - #3 (images)
- 28-Feb-2004 06:44 PM 2004 🚘 Canadian International AutoShow #31 (Toronto) - #2 (SD, images)
- 28-Feb-2004 05:26 PM 2004 🚘 Canadian International AutoShow #31 (Toronto) - #1 (images)
- 28-Feb-2004 05:26 PM 2004 🚘 Canadian International AutoShow #31 (Toronto) - #1 (images)